
State of the Crypto Markets — Part 1 (Q2 2025)
Uncovering the Truth Behind the Bitcoin Correction, Liquidity Cycles, and the Next Big Move in Crypto — Before the Crowd Catches On.

(This is part one of an ongoing series investigating the crypto markets and building the correct thesis for maximum risk-adjusted profits.)

Introduction
Good morning (or evening) traders and investors,
It is with great pleasure that I bring you this report at such a pivotal moment. The crypto and equity markets are currently experiencing extreme fear, with the most recent sell-off largely attributed to a rise in Japanese interest rates and newly announced tariffs. This macroeconomic shift has led to an unwinding of risk, causing asset prices to pull back to more attractive levels compared to the speculative highs seen during the 2024 U.S. election cycle and Trump’s inauguration.
If you’ve been following my research and analysis, you’ll know that we positioned ourselves ahead of the market and capitalized on the October–January rally before de-risking above $100,000 BTC, exiting at $104,000. Now, we have begun selectively redeploying capital into assets expected to outperform, which I will cover in later parts of this thesis. However, before diving into specific strategies, it is essential to assess the overall state of the crypto market to determine whether the bull market remains intact and what the data suggests about the road ahead.
1. What Caused the Recent Correction? (And the Crash of Memecoins)
To determine if the broader crypto bull market remains intact, we first need to identify the catalysts behind the correction.
Market Structure Before the Crash
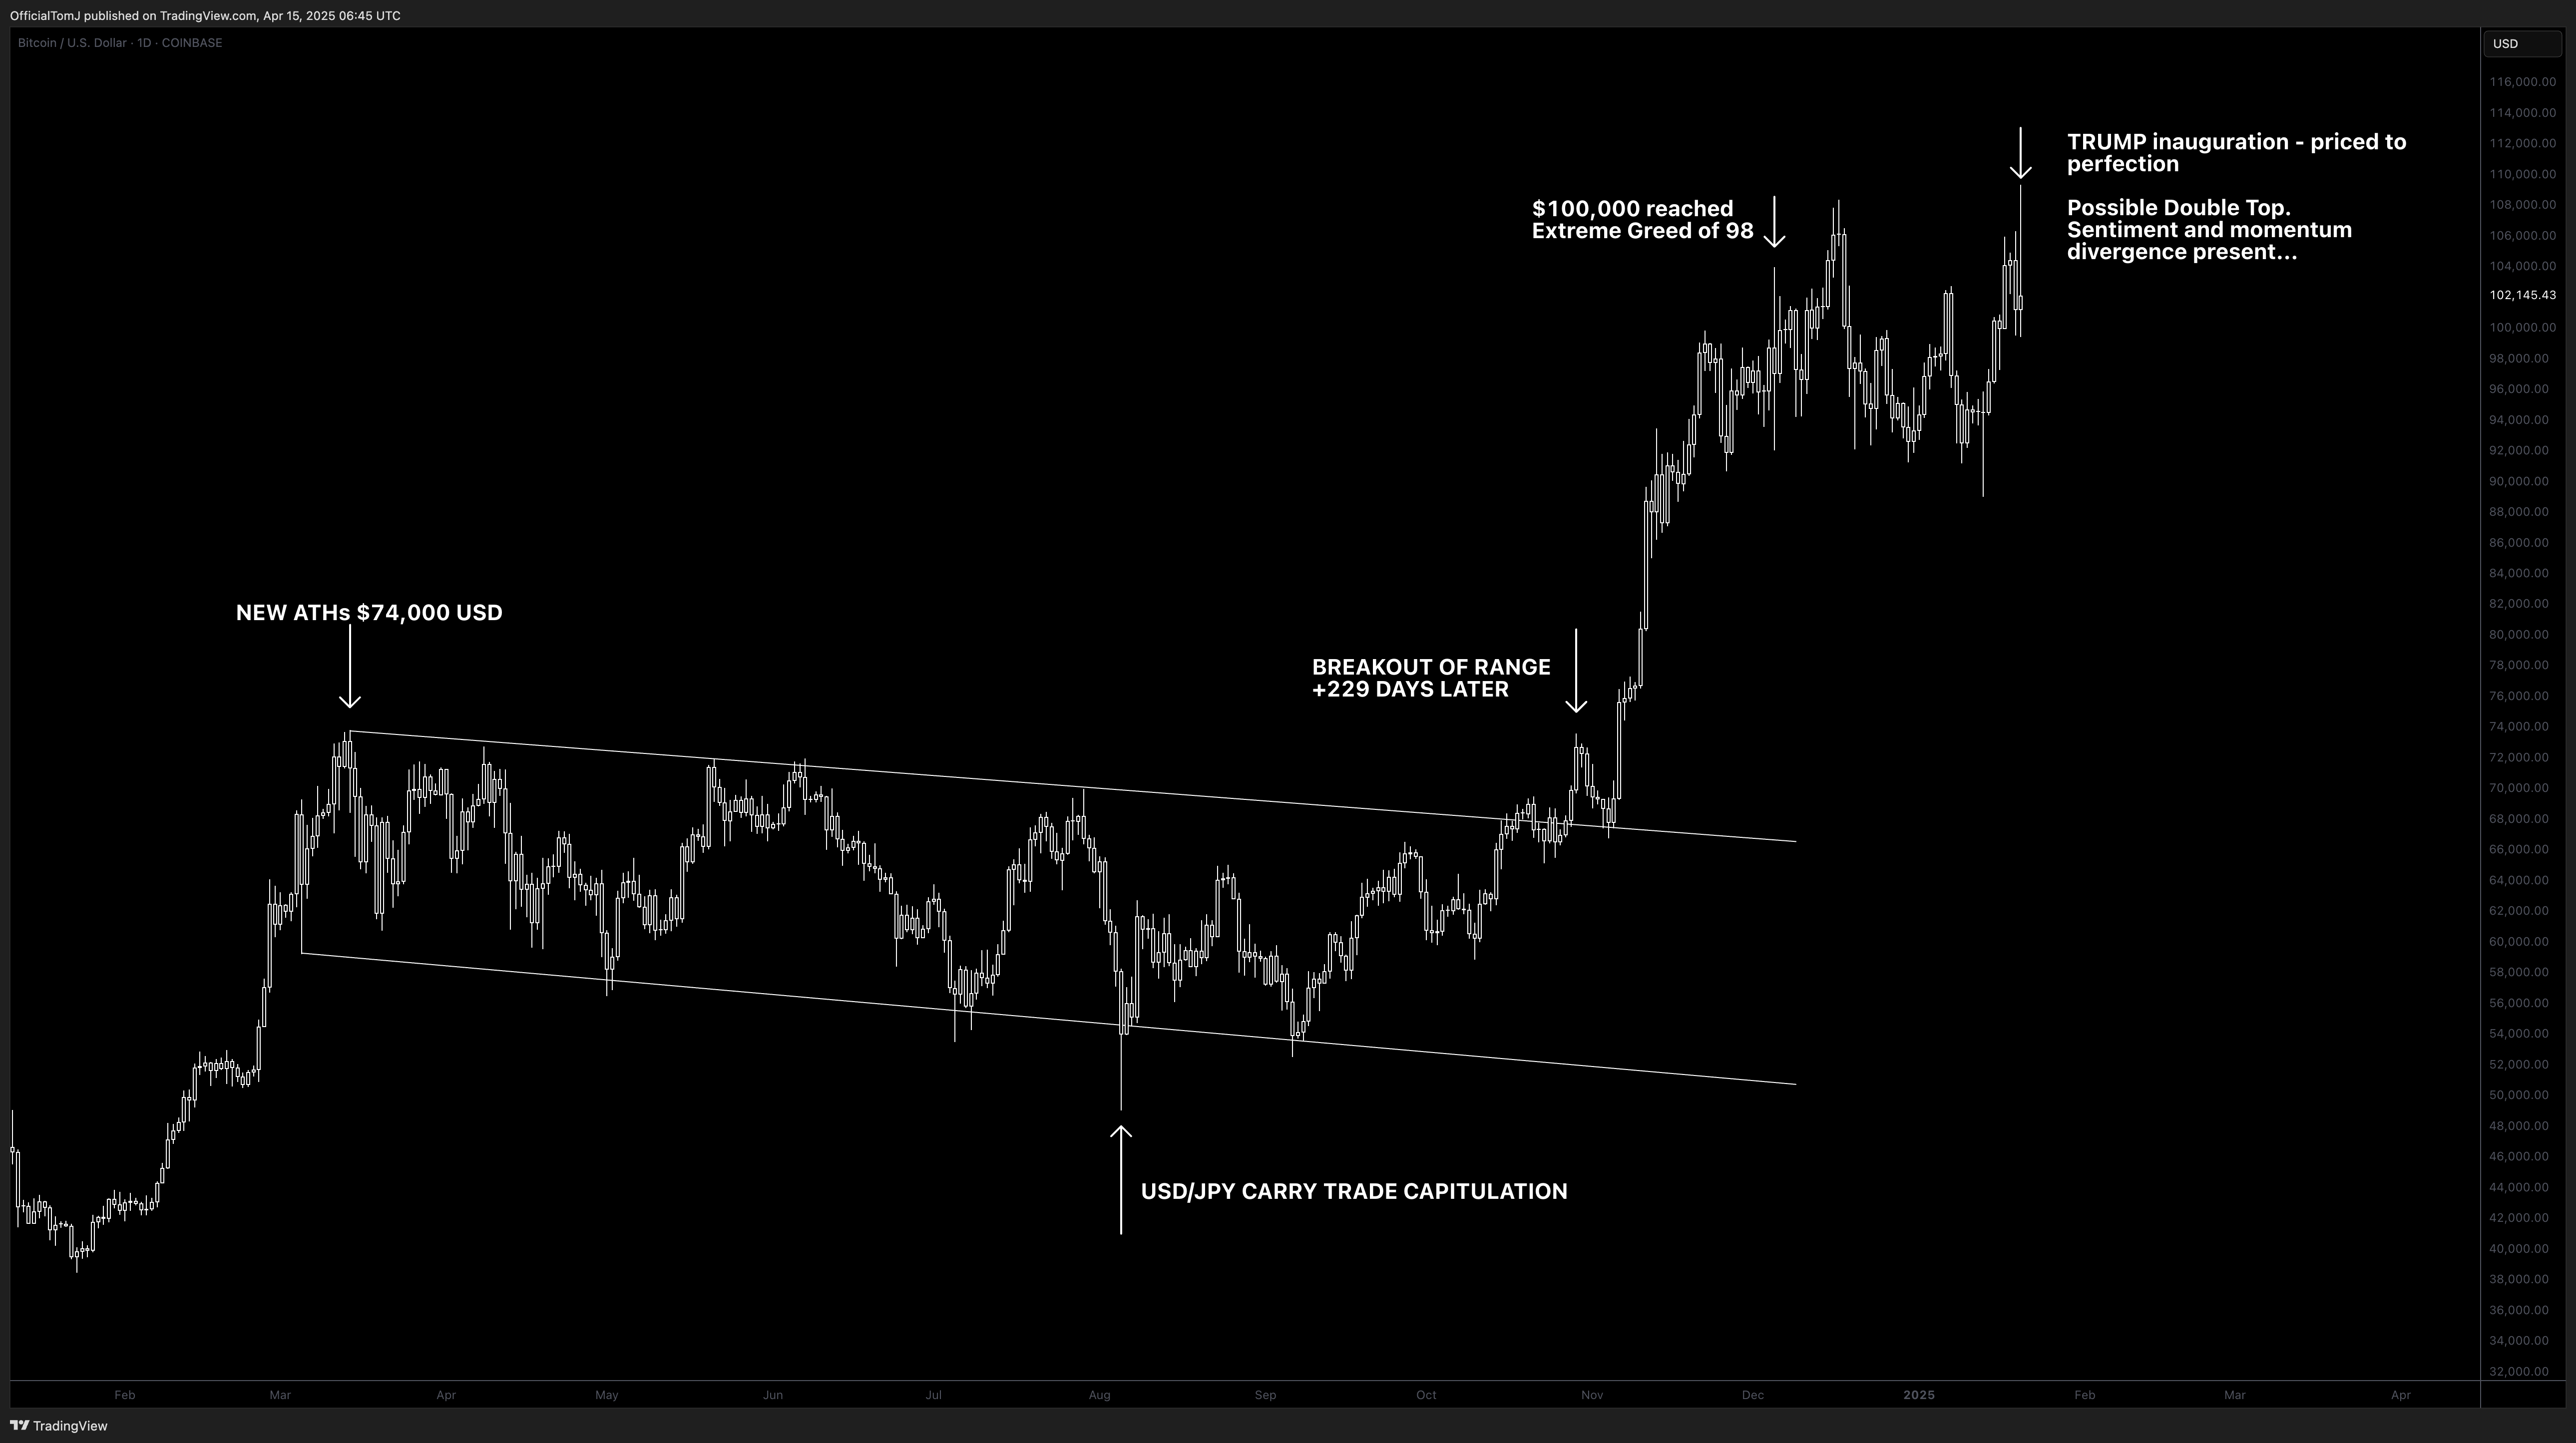
Leading into November 2024, Bitcoin was consolidating in a healthy channel after setting a new all-time high of $74,000. The rally was fuelled by strong ETF inflows and MicroStrategy (now Strategy) continued BTC accumulation, but price action remained relatively contained within a 200-day range. During this period, external macro risks, such as the unwinding of the USD/JPY carry trade due to Bank of Japan interest rate hikes, caused occasional spikes in volatility.
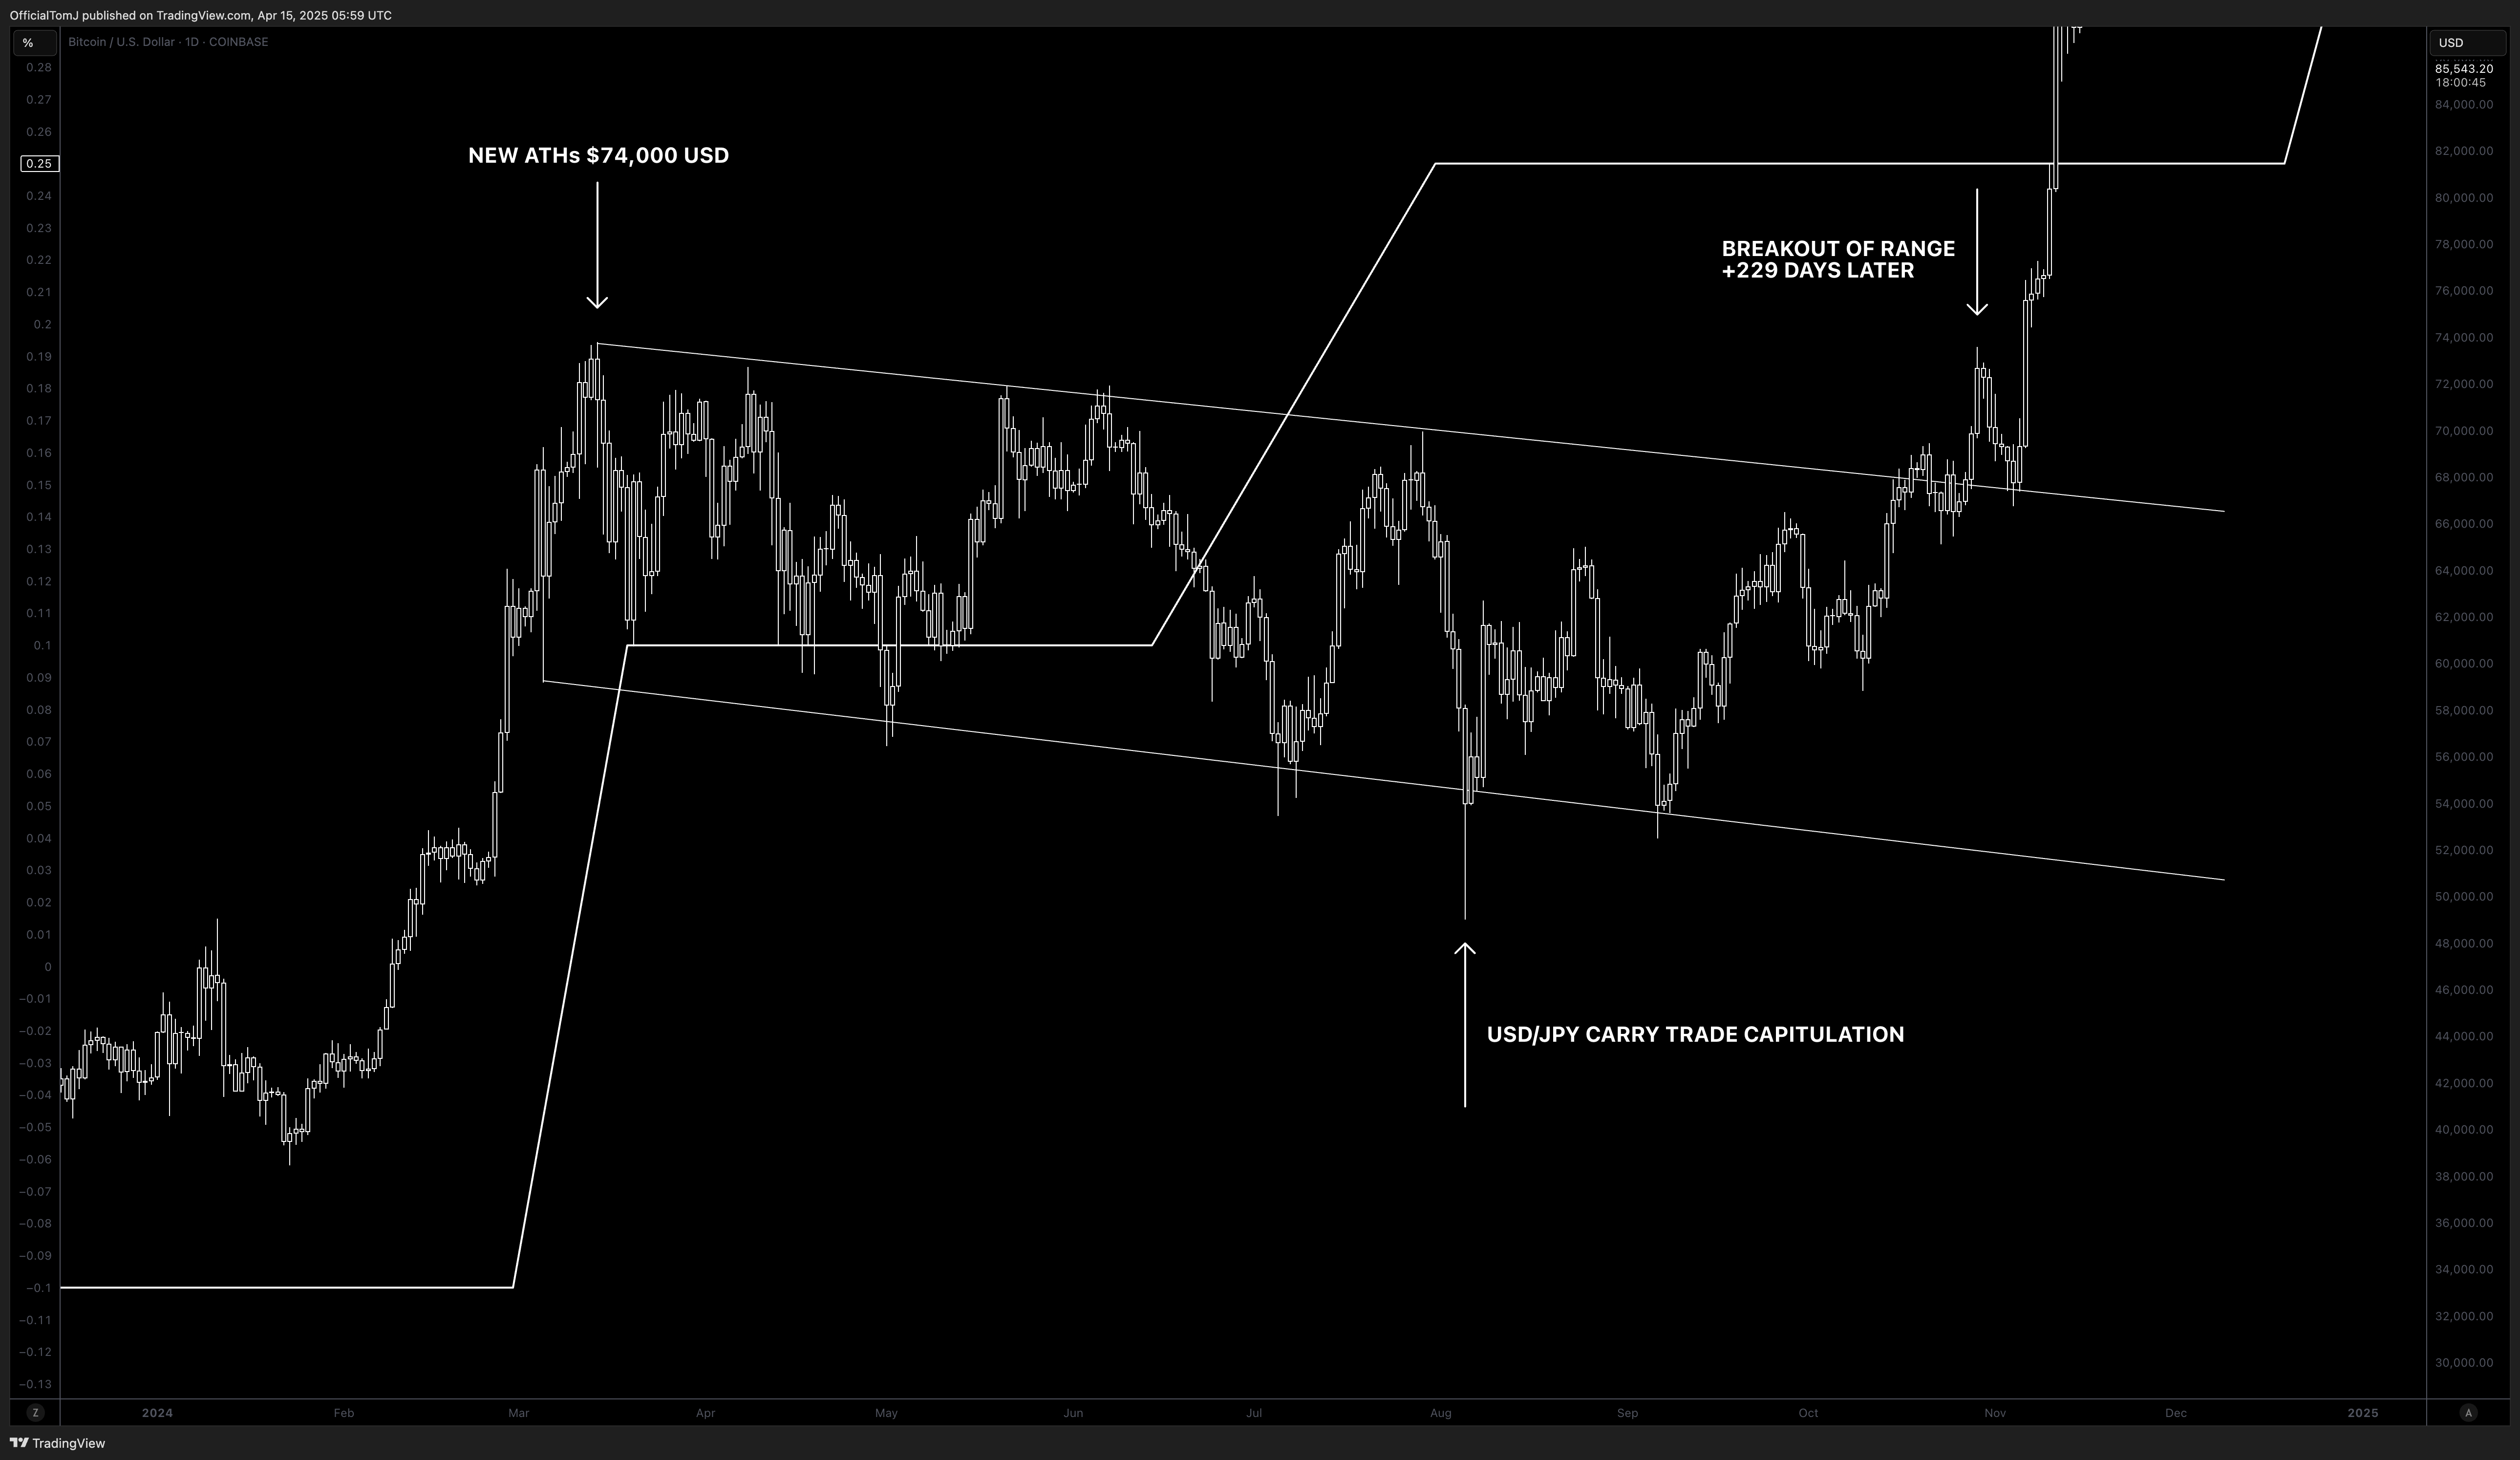
The Election Rally and Trump’s Impact on Crypto
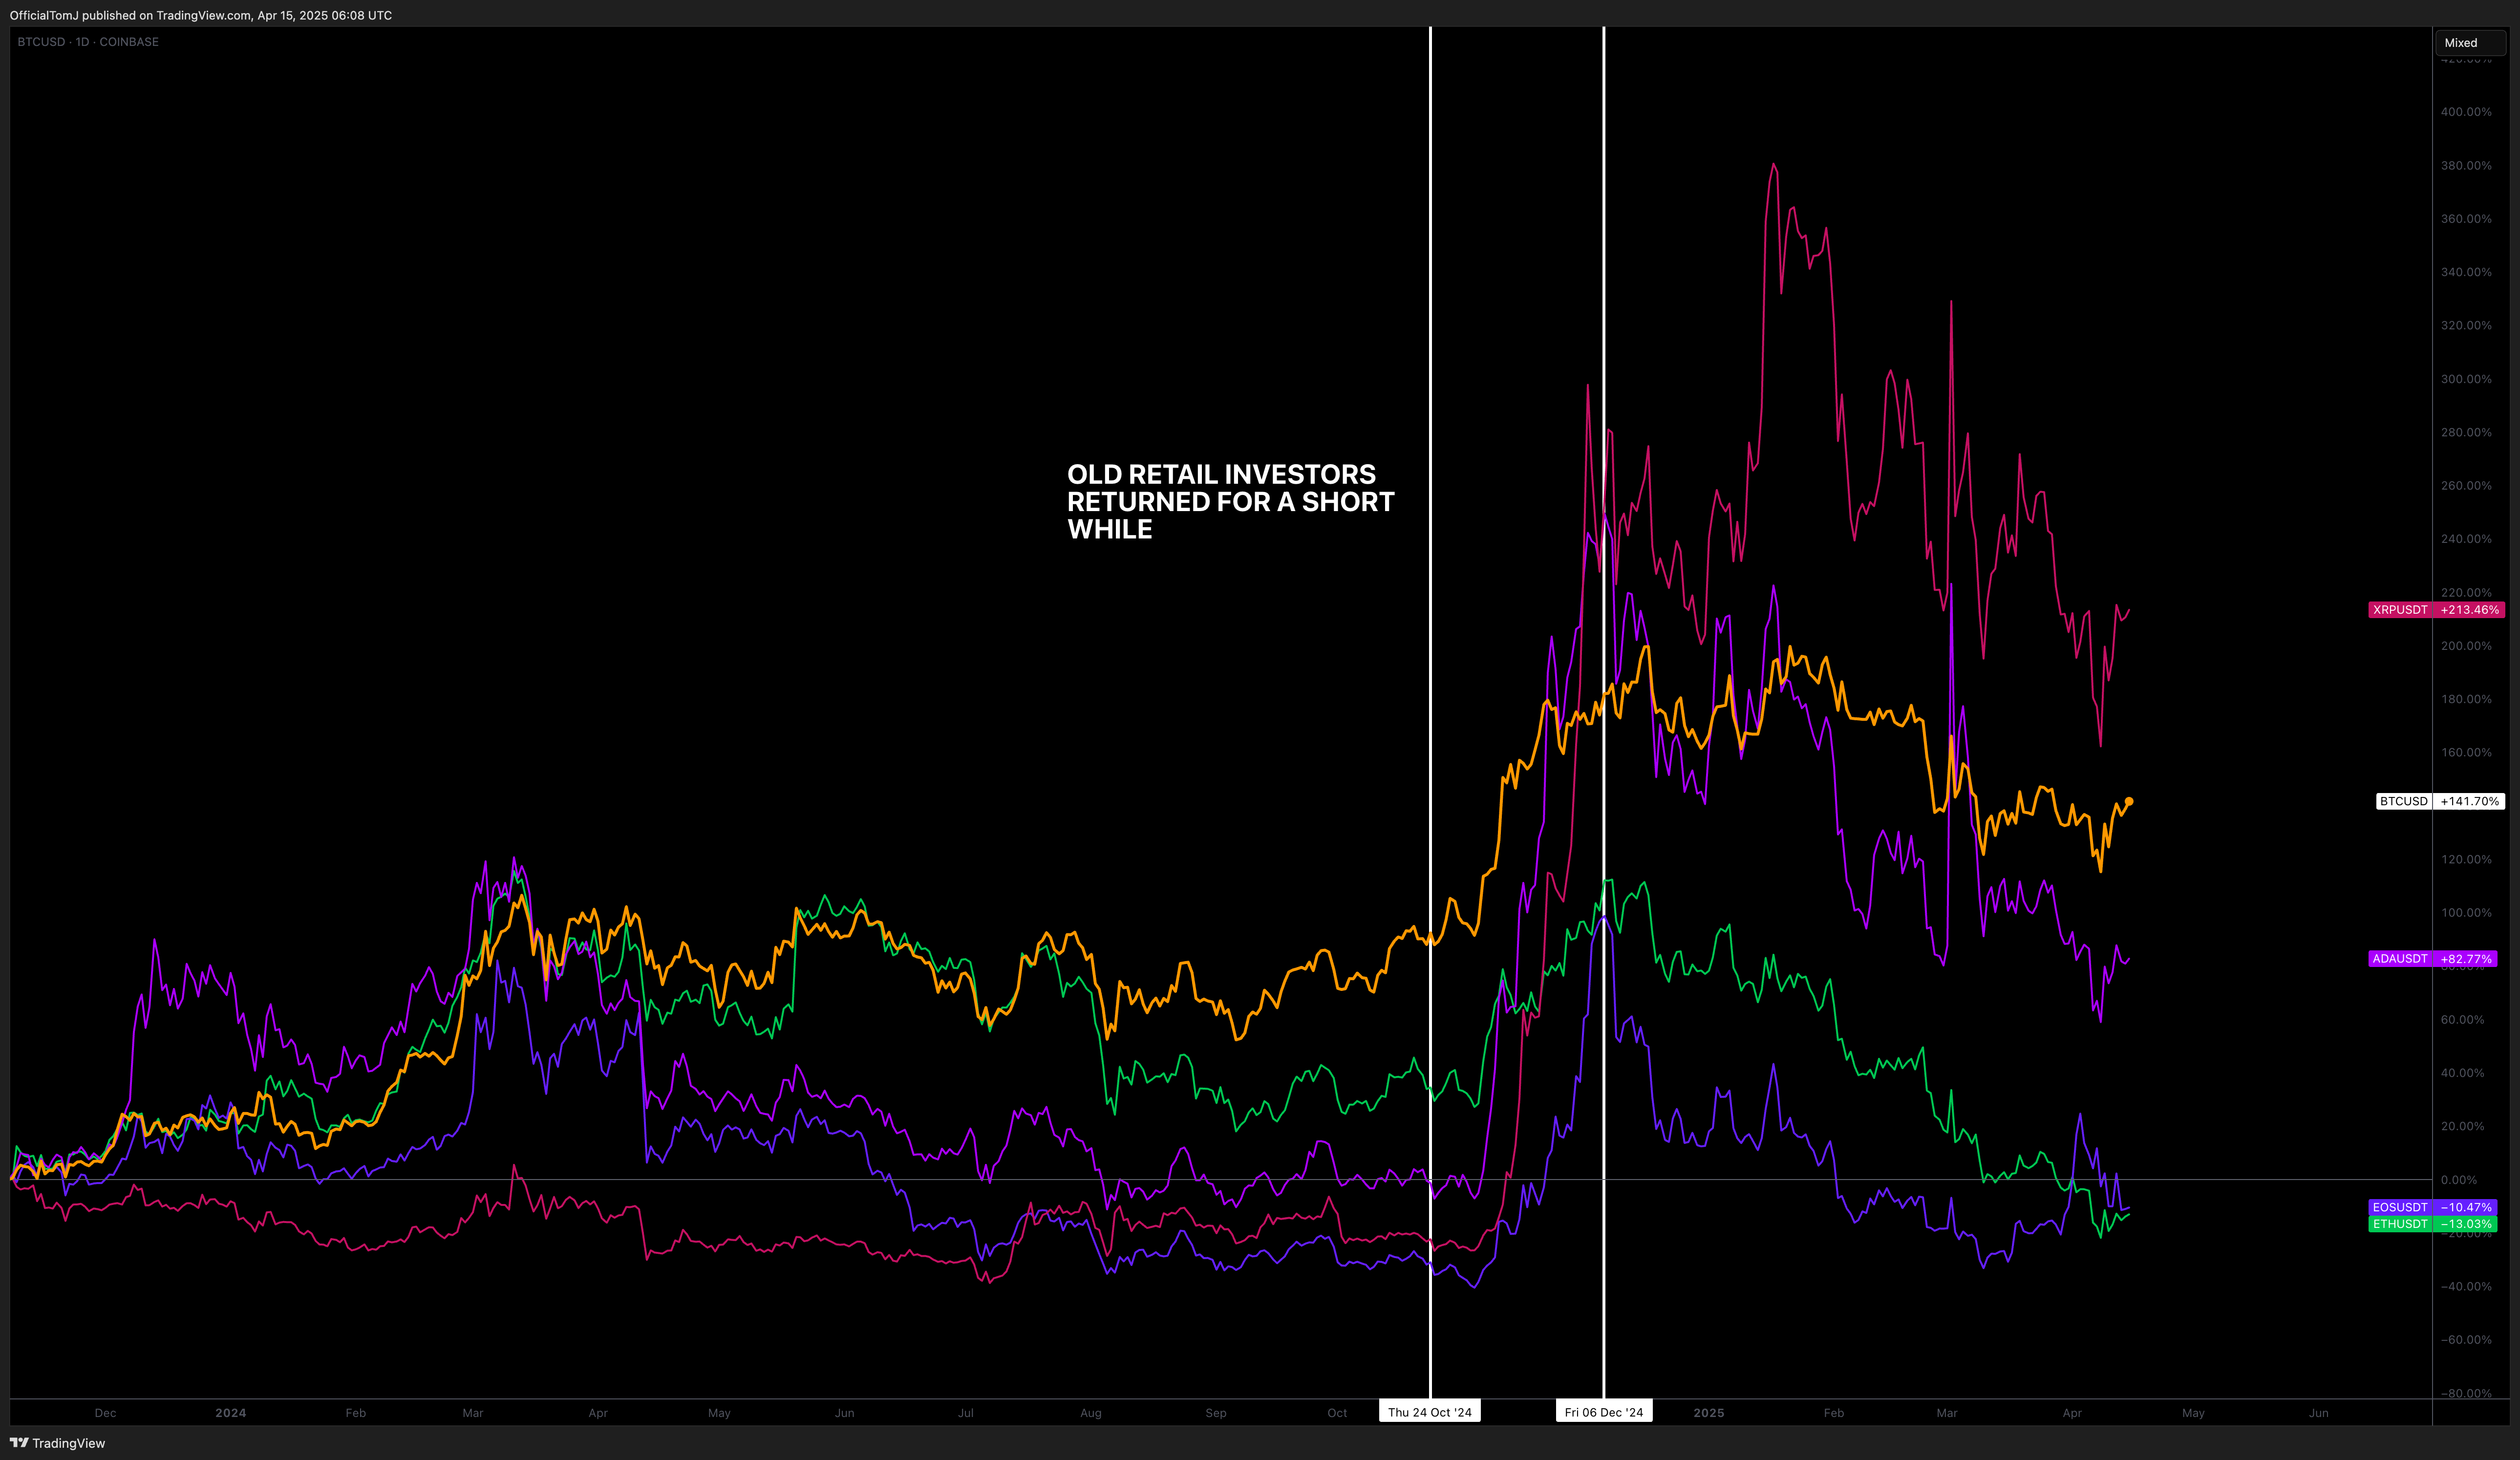
The market’s next breakout was triggered by the U.S. election, as prediction markets started pricing in a Trump victory, leading to a risk-on rally across BTC and crypto assets. As BTC surged past $74,000, momentum carried the price toward $100,000, driven by institutional buying via ETF products, a significant return of retail traders to the market, and the resurgence of legacy altcoins like XRP, ADA, and EOS. Additionally, new narratives surrounding Trump-related assets, including ETH, LINK, ONDO, and ENA, gained traction.
The Rise and Fall of the Memecoin Bubble
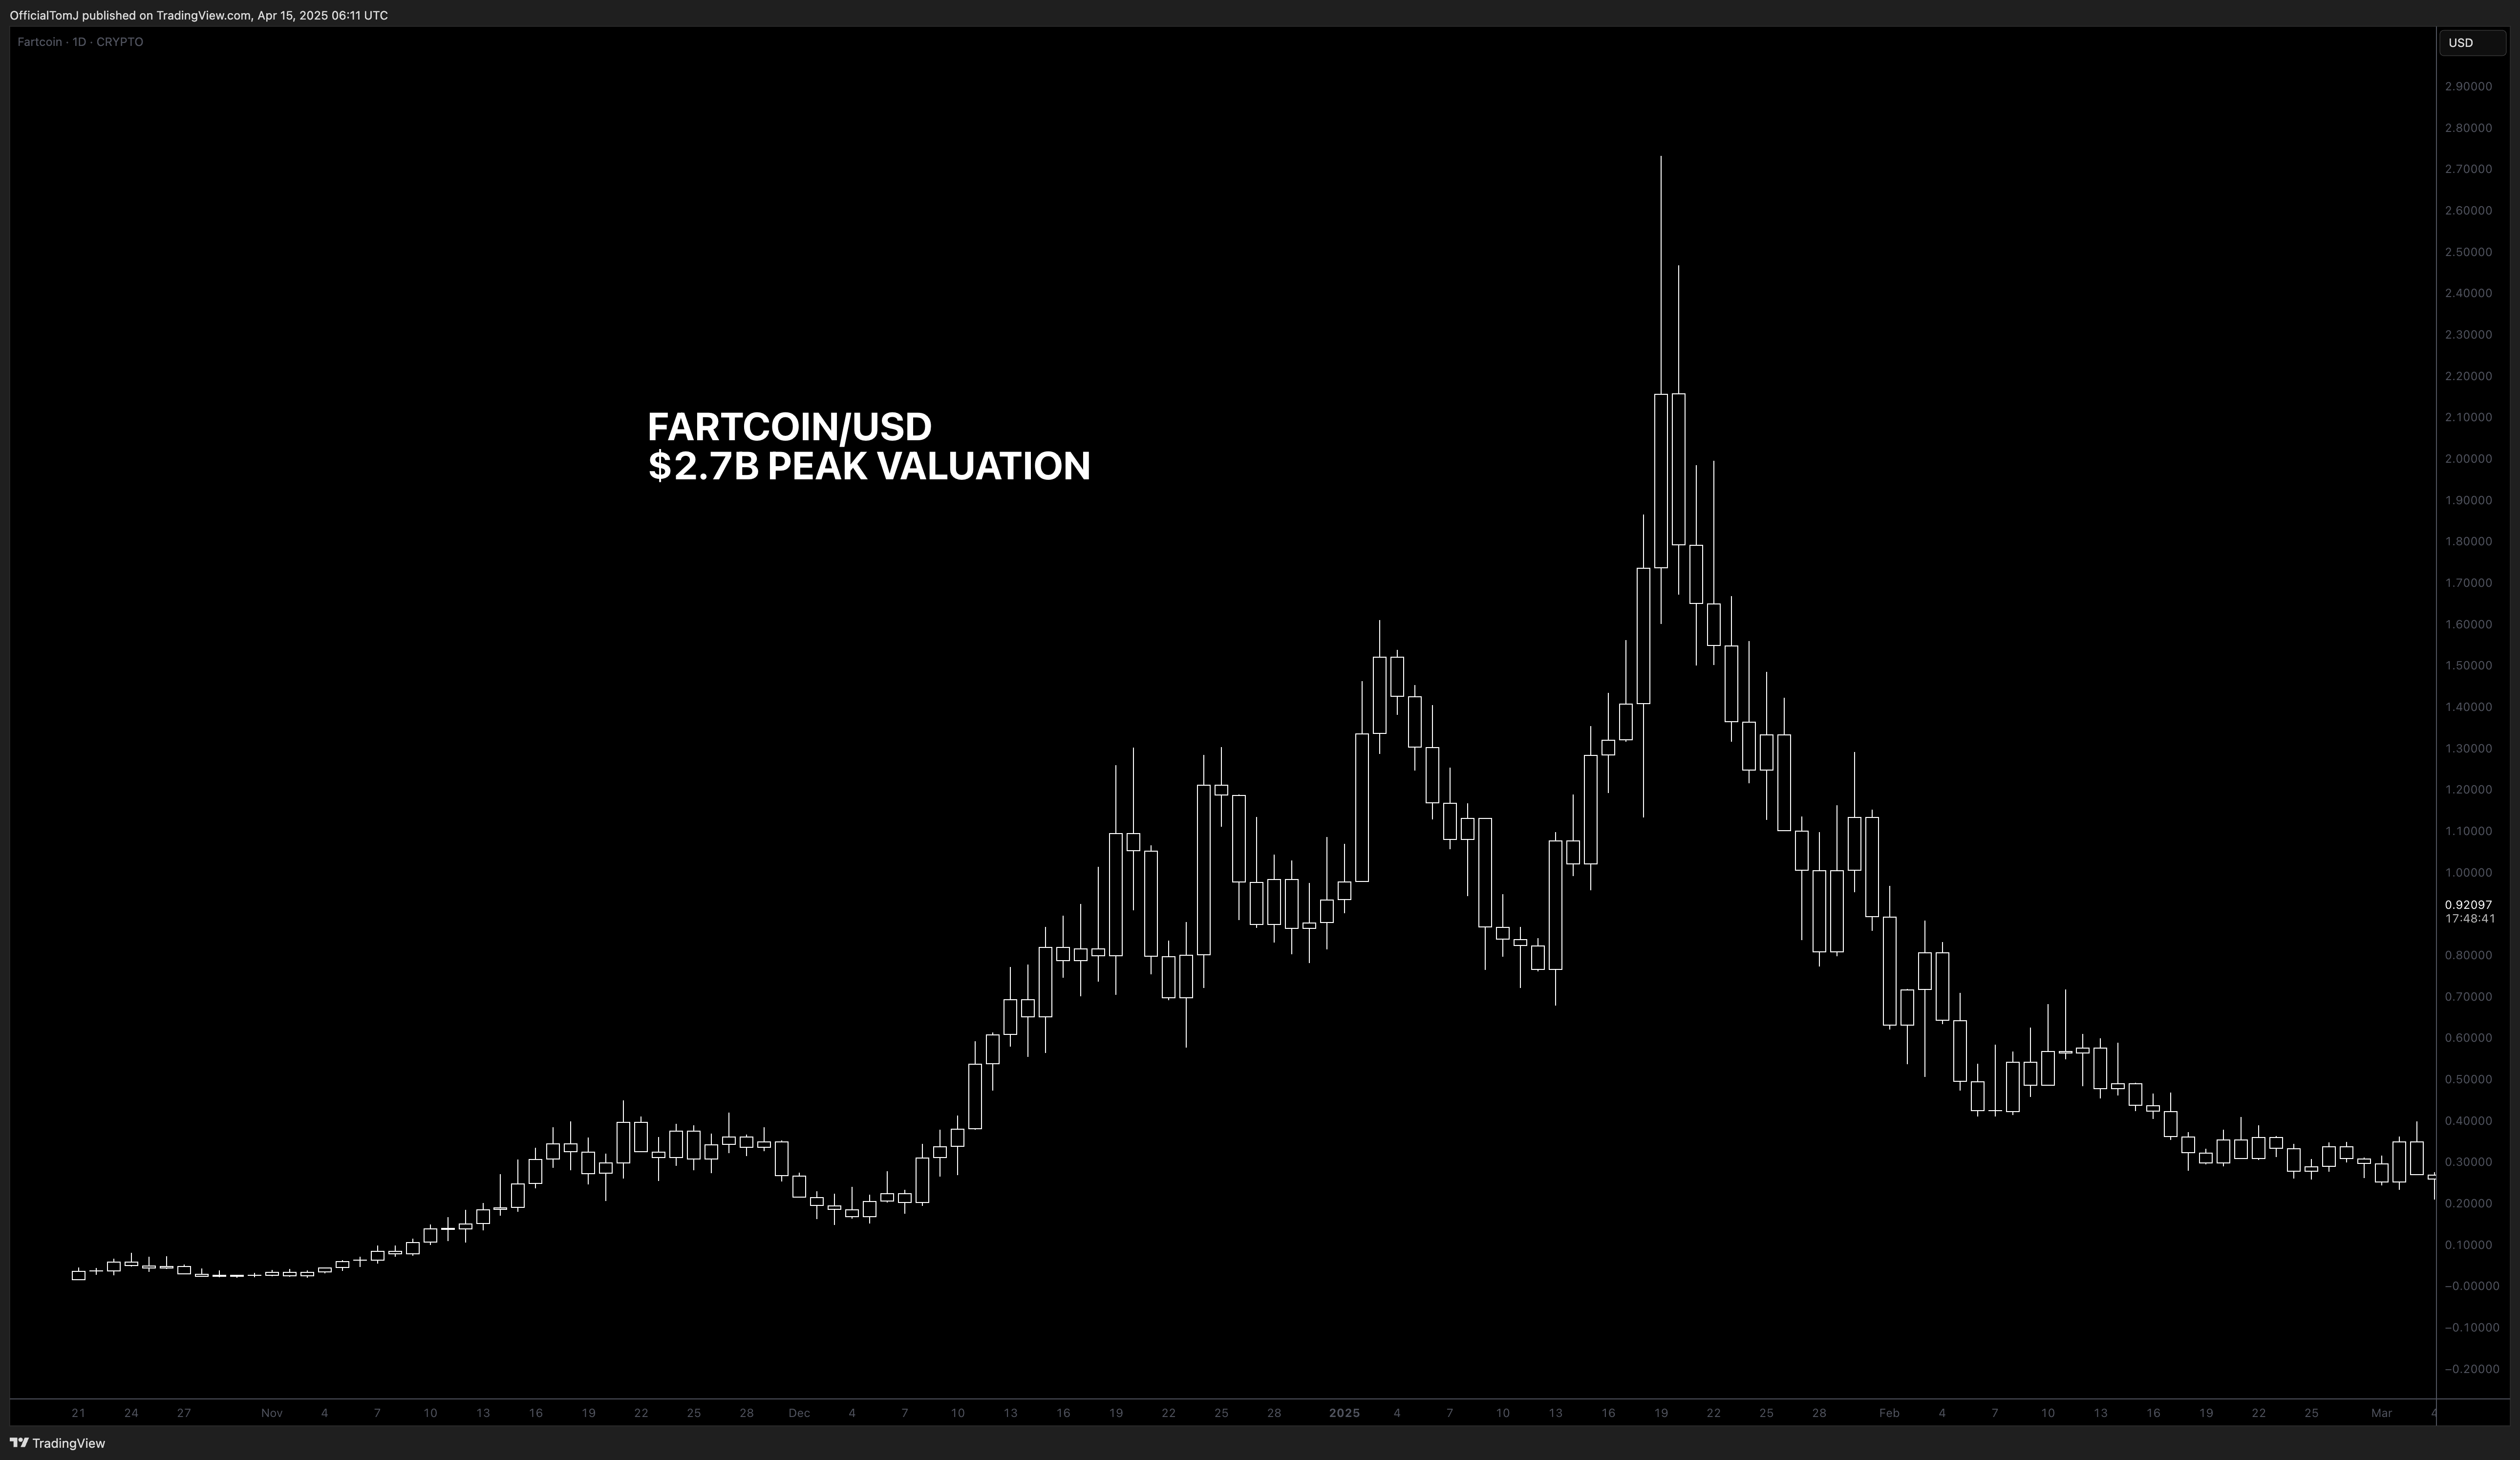
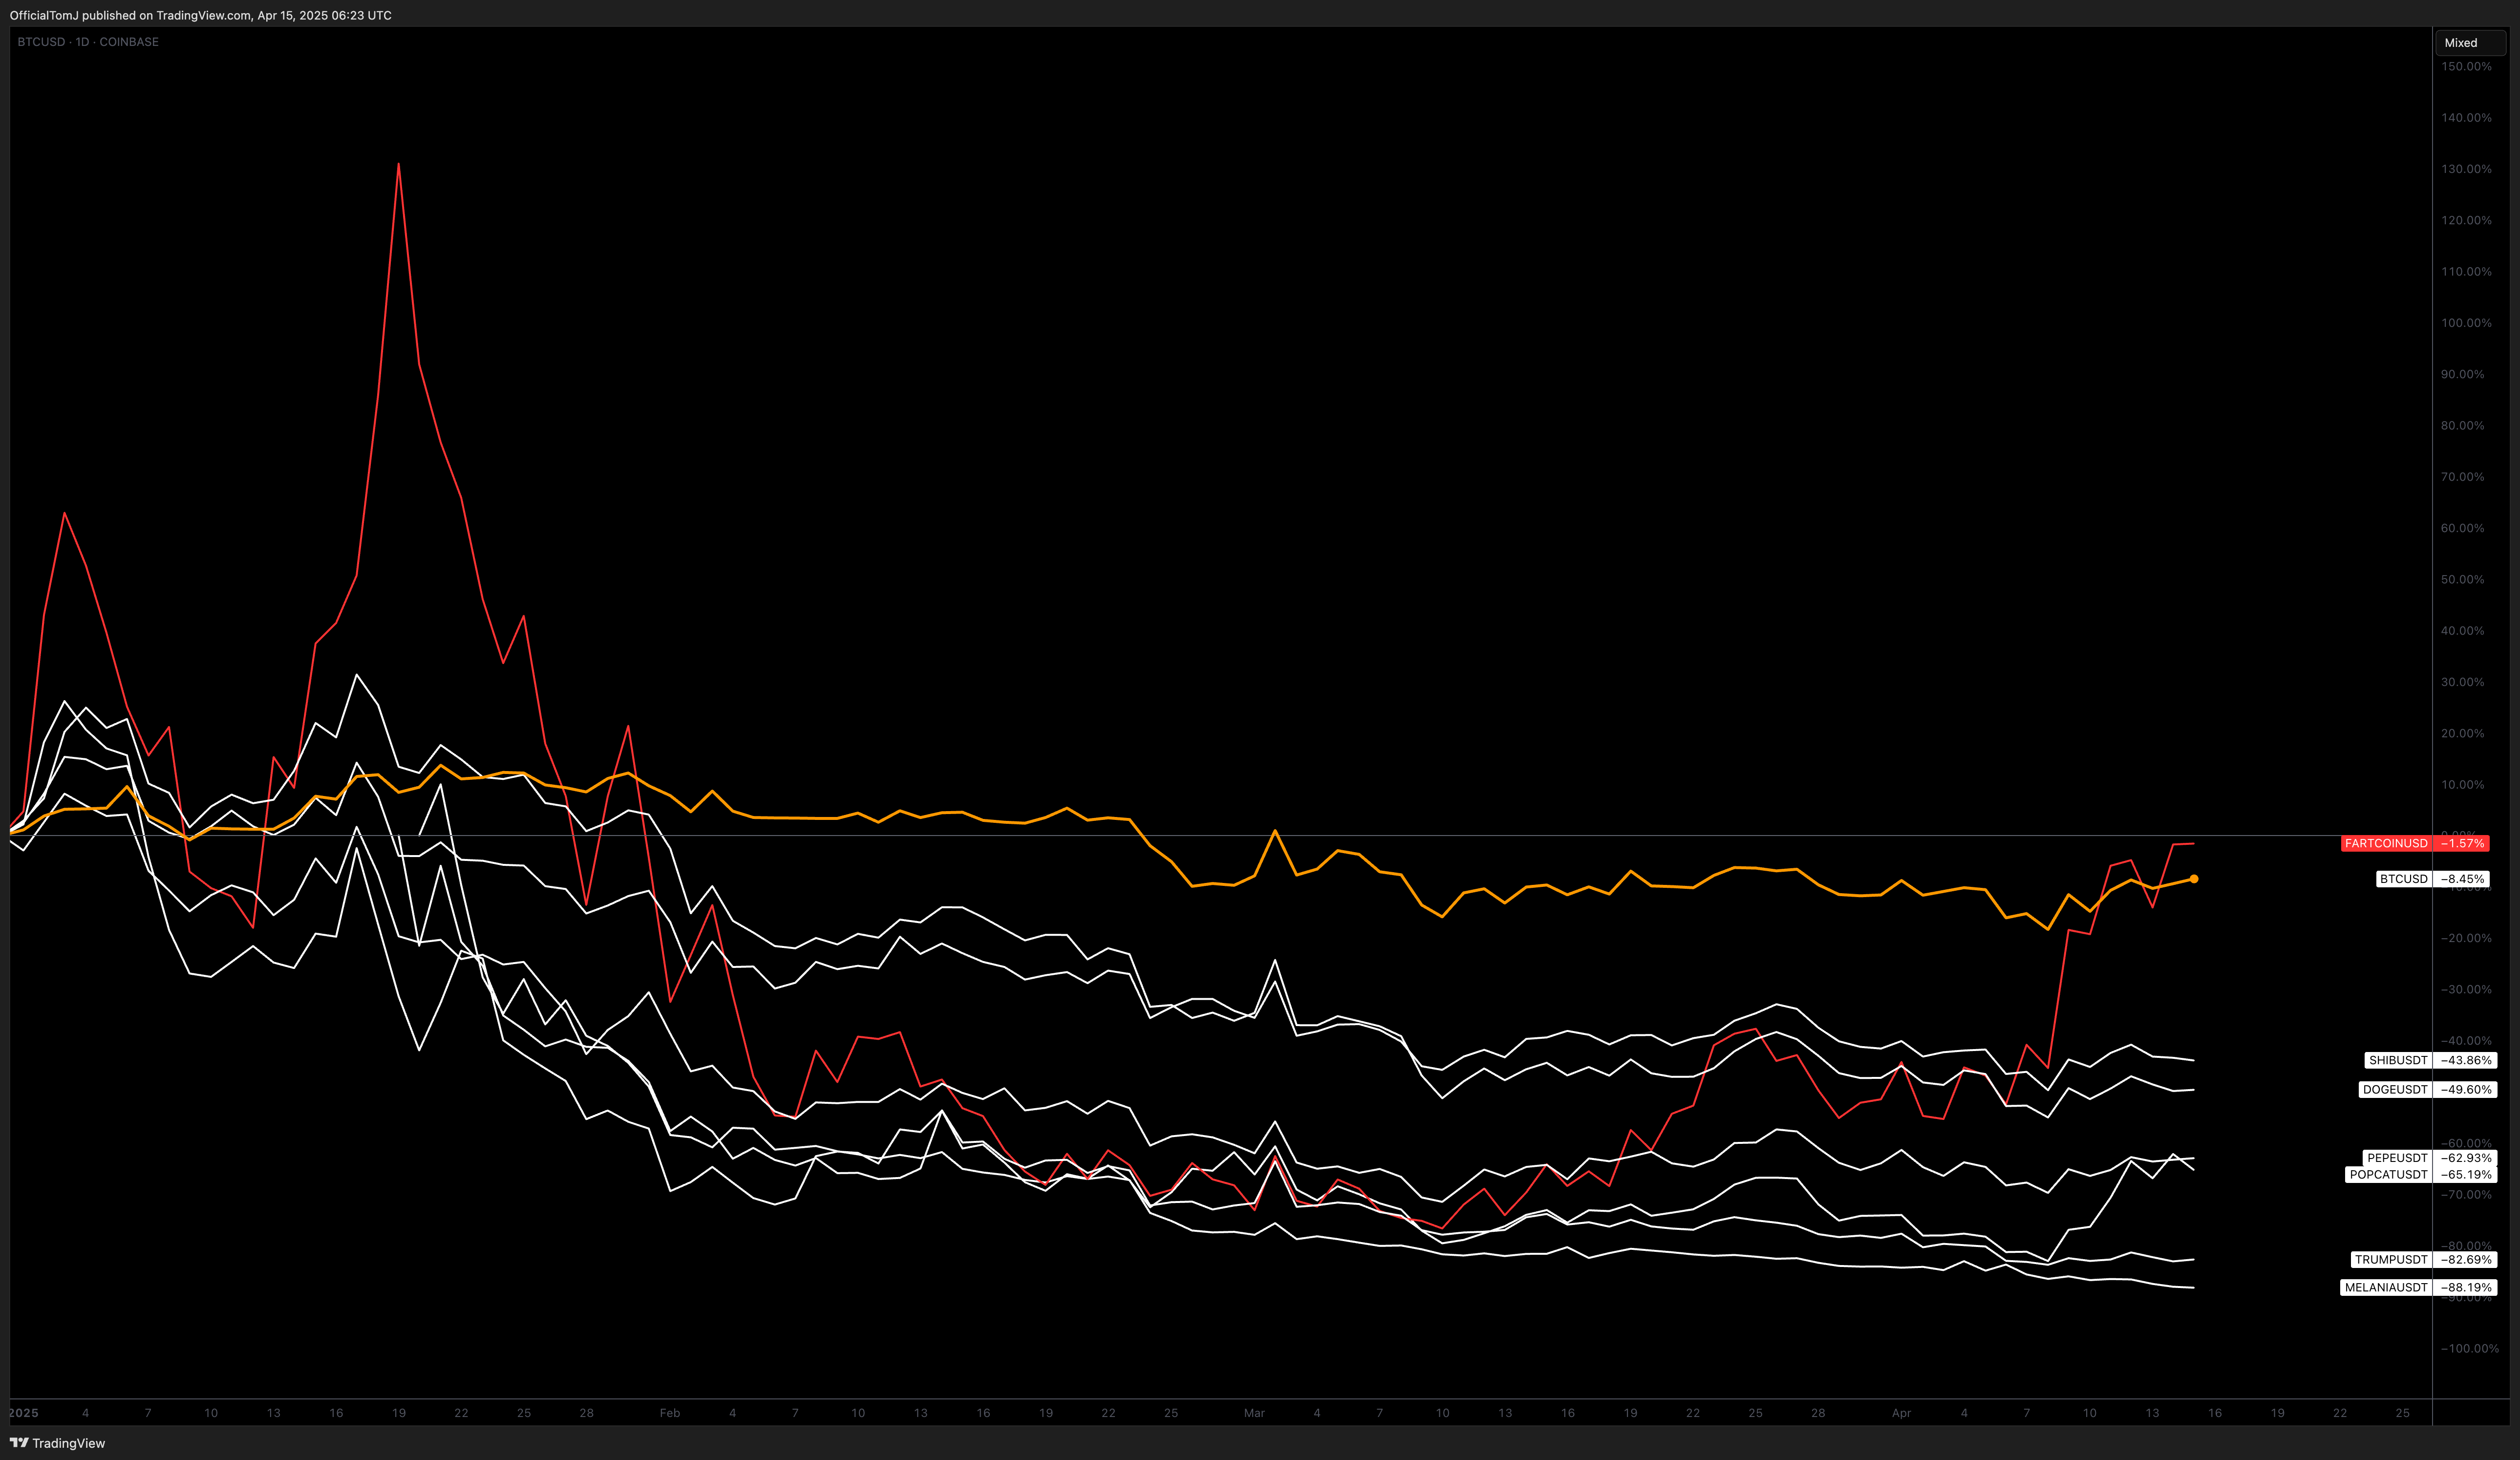
While Bitcoin and large-cap altcoins were experiencing healthy growth, an even greater mania was unfolding in the memecoin sector. The speculative demand for meme tokens reached unprecedented levels, with Dogecoin soaring from $0.15 to $0.50, igniting widespread retail FOMO. Platforms such as Pump.fun facilitated an explosion of new token launches, leading to the rise of highly speculative assets like FARTCOIN, which skyrocketed to a $2.7 billion market cap within 90 days.
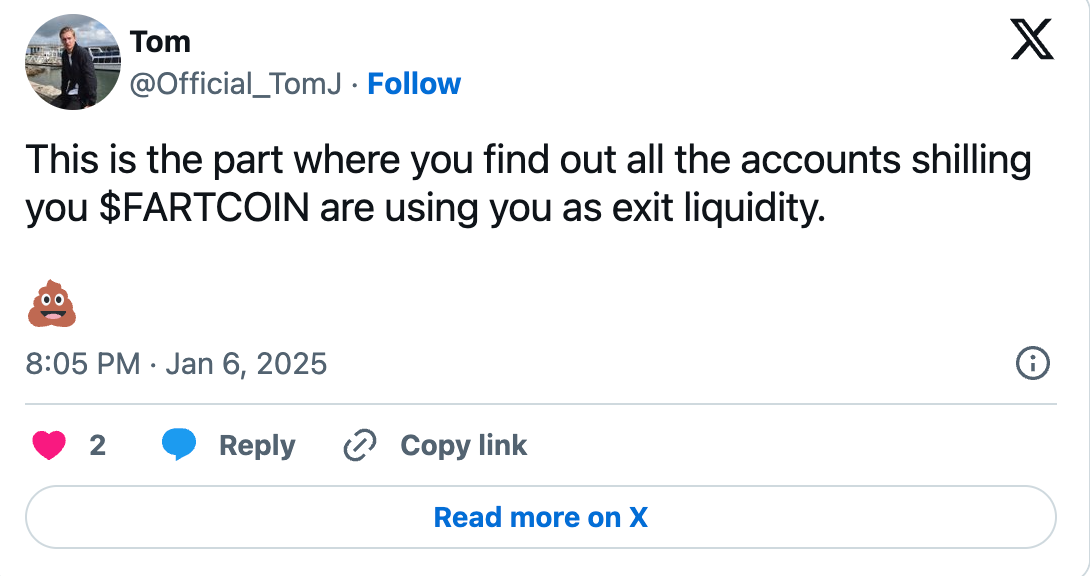
Unlike past altcoin cycles that were at least loosely based on utility narratives, this phase became a purely PvP (player versus player) trading environment. Retail traders provided liquidity, while insiders and platform operators extracted the majority of the profits. Seeing the excess, I warned on X about the imminent collapse of the memecoin bubble and took short positions, which ended up being highly profitable.
(prices continued to spike into the top, after the initial shorts. Which we also capitalised on)
The True Catalyst: Trump’s Own Memecoin $TRUMP
While FARTCOIN and similar speculative assets eventually crashed by over 90%, the real turning point came when Donald Trump’s team launched its own memecoin (TRUMP/USD) on Solana. With 80% of the supply held by Trump-affiliated wallets, the token surged to a $14.5 billion market cap around Trump’s inauguration, only to collapse shortly after. This event triggered contagion across the entire market, leading to a $1.3 trillion total crypto market cap wipeout.
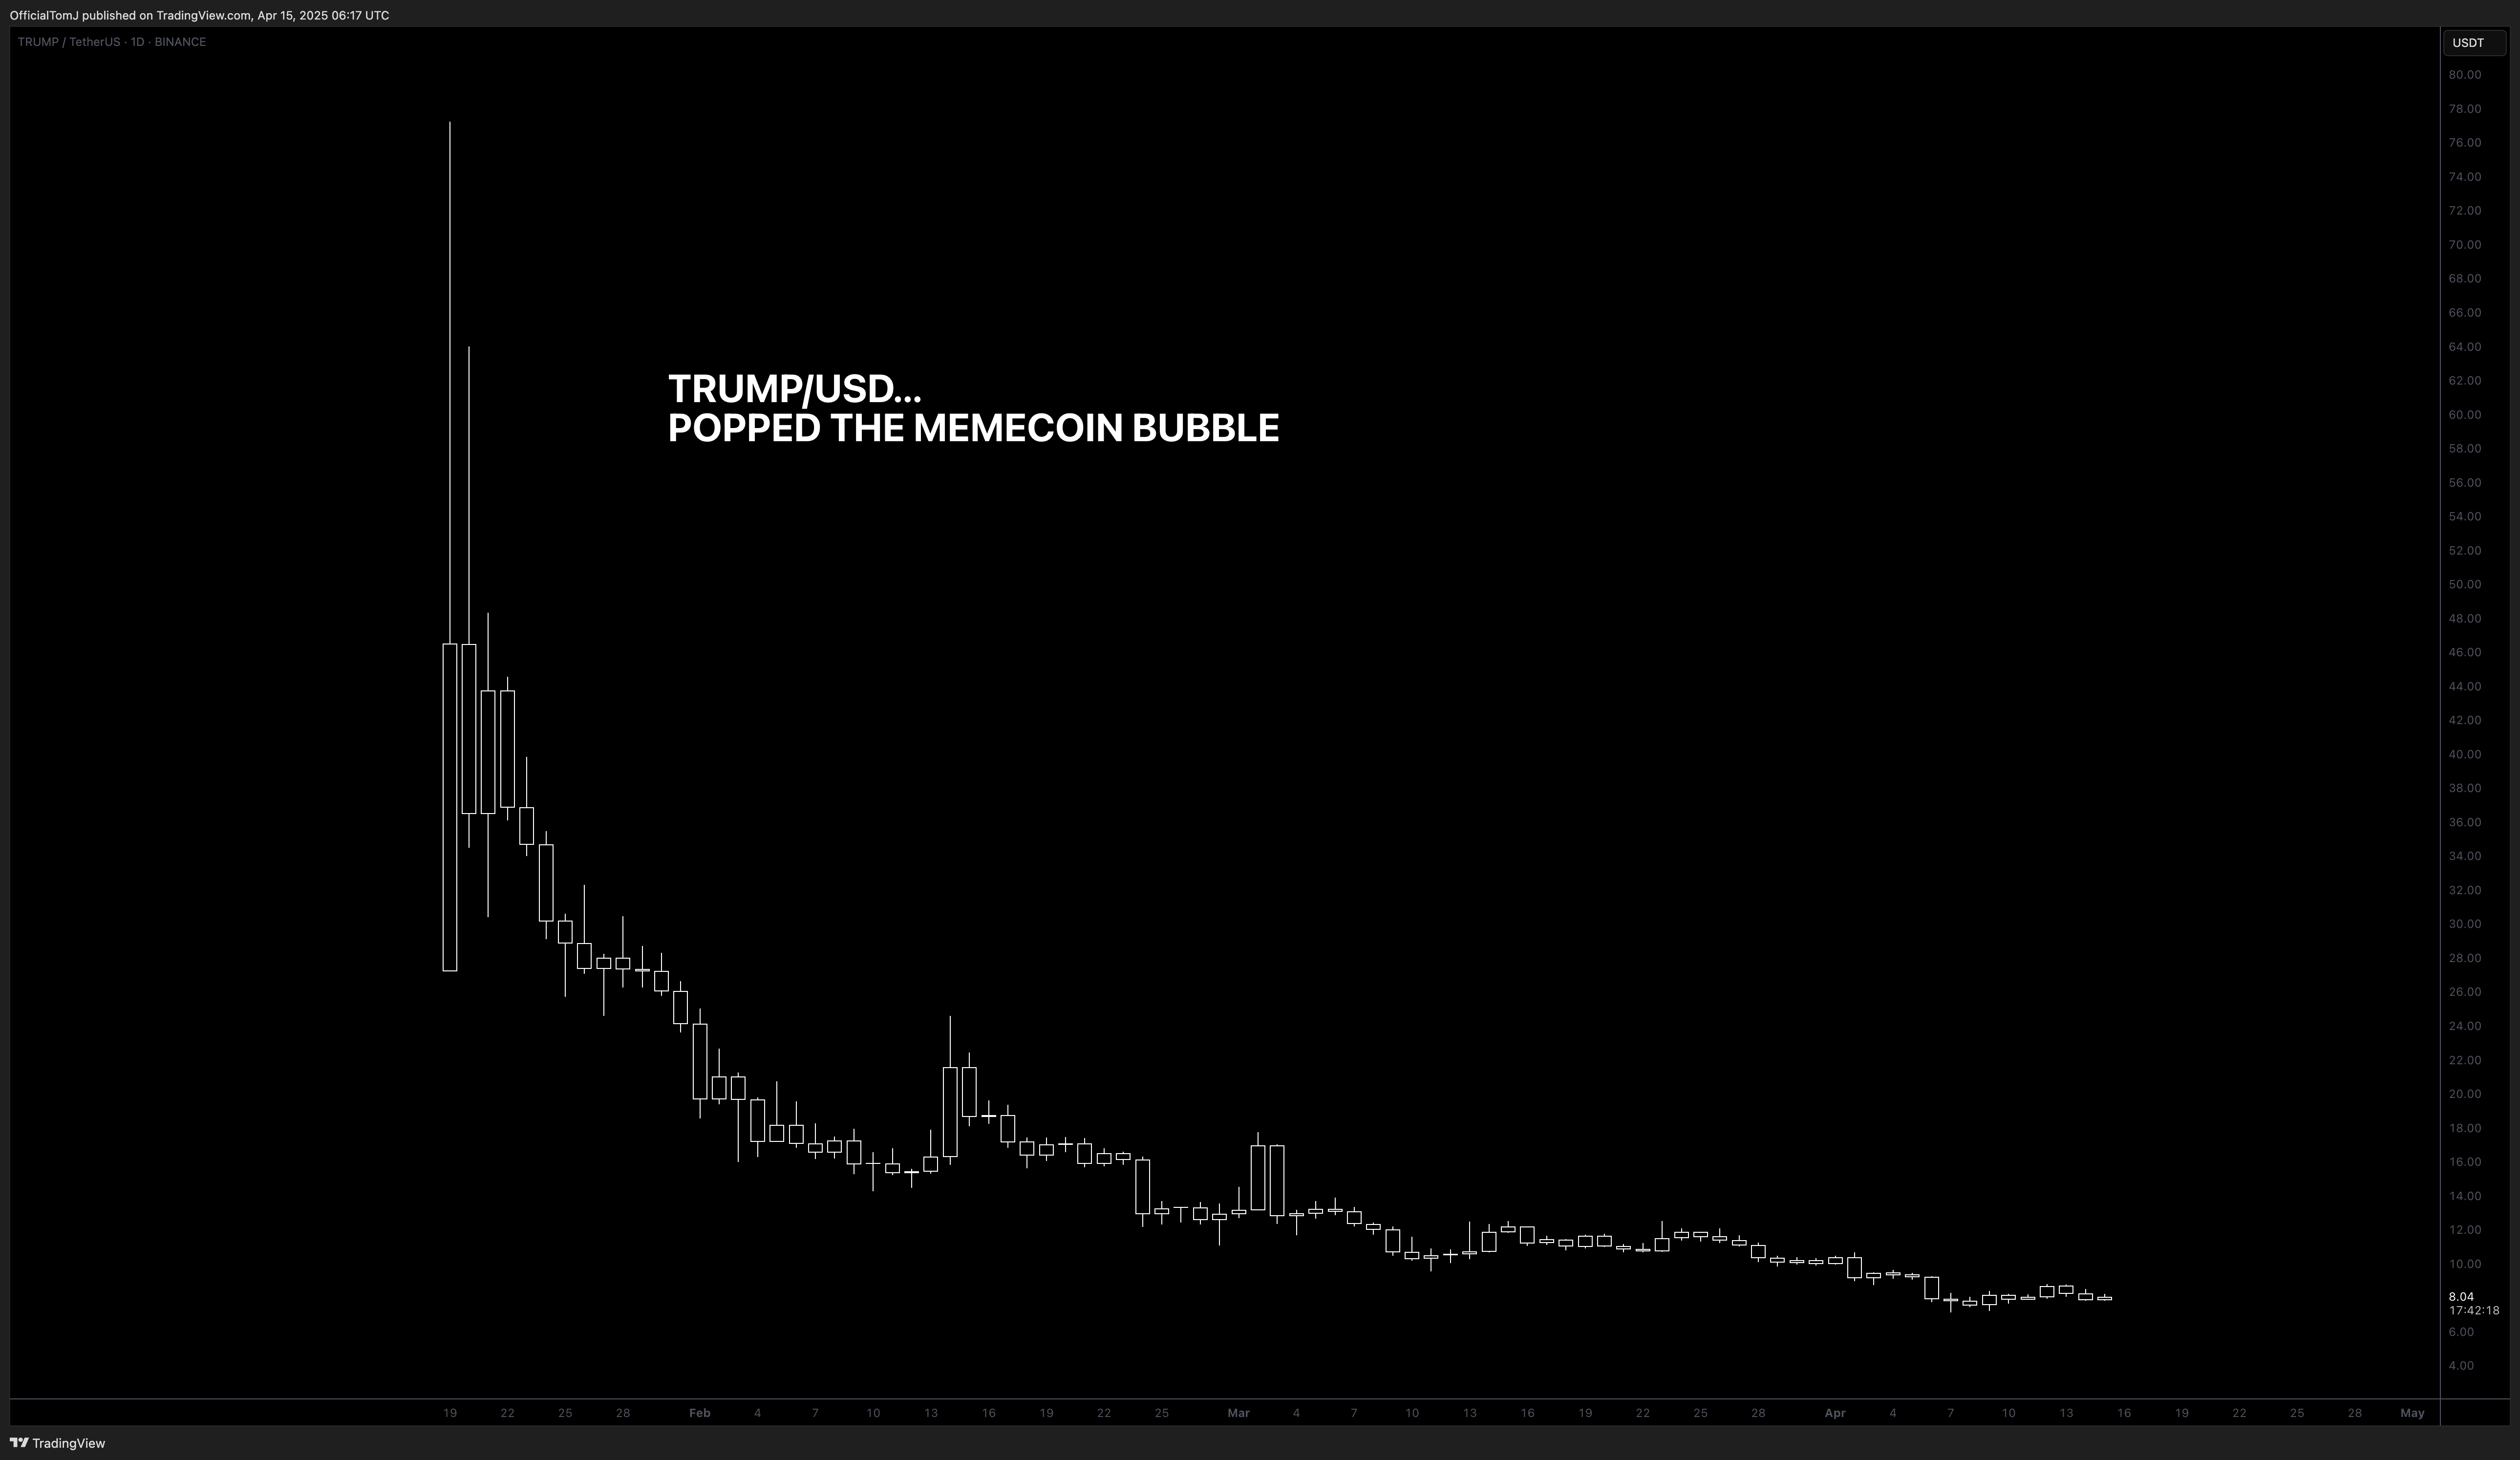
The Aftermath: BTC Holds Up, Memecoins Crushed
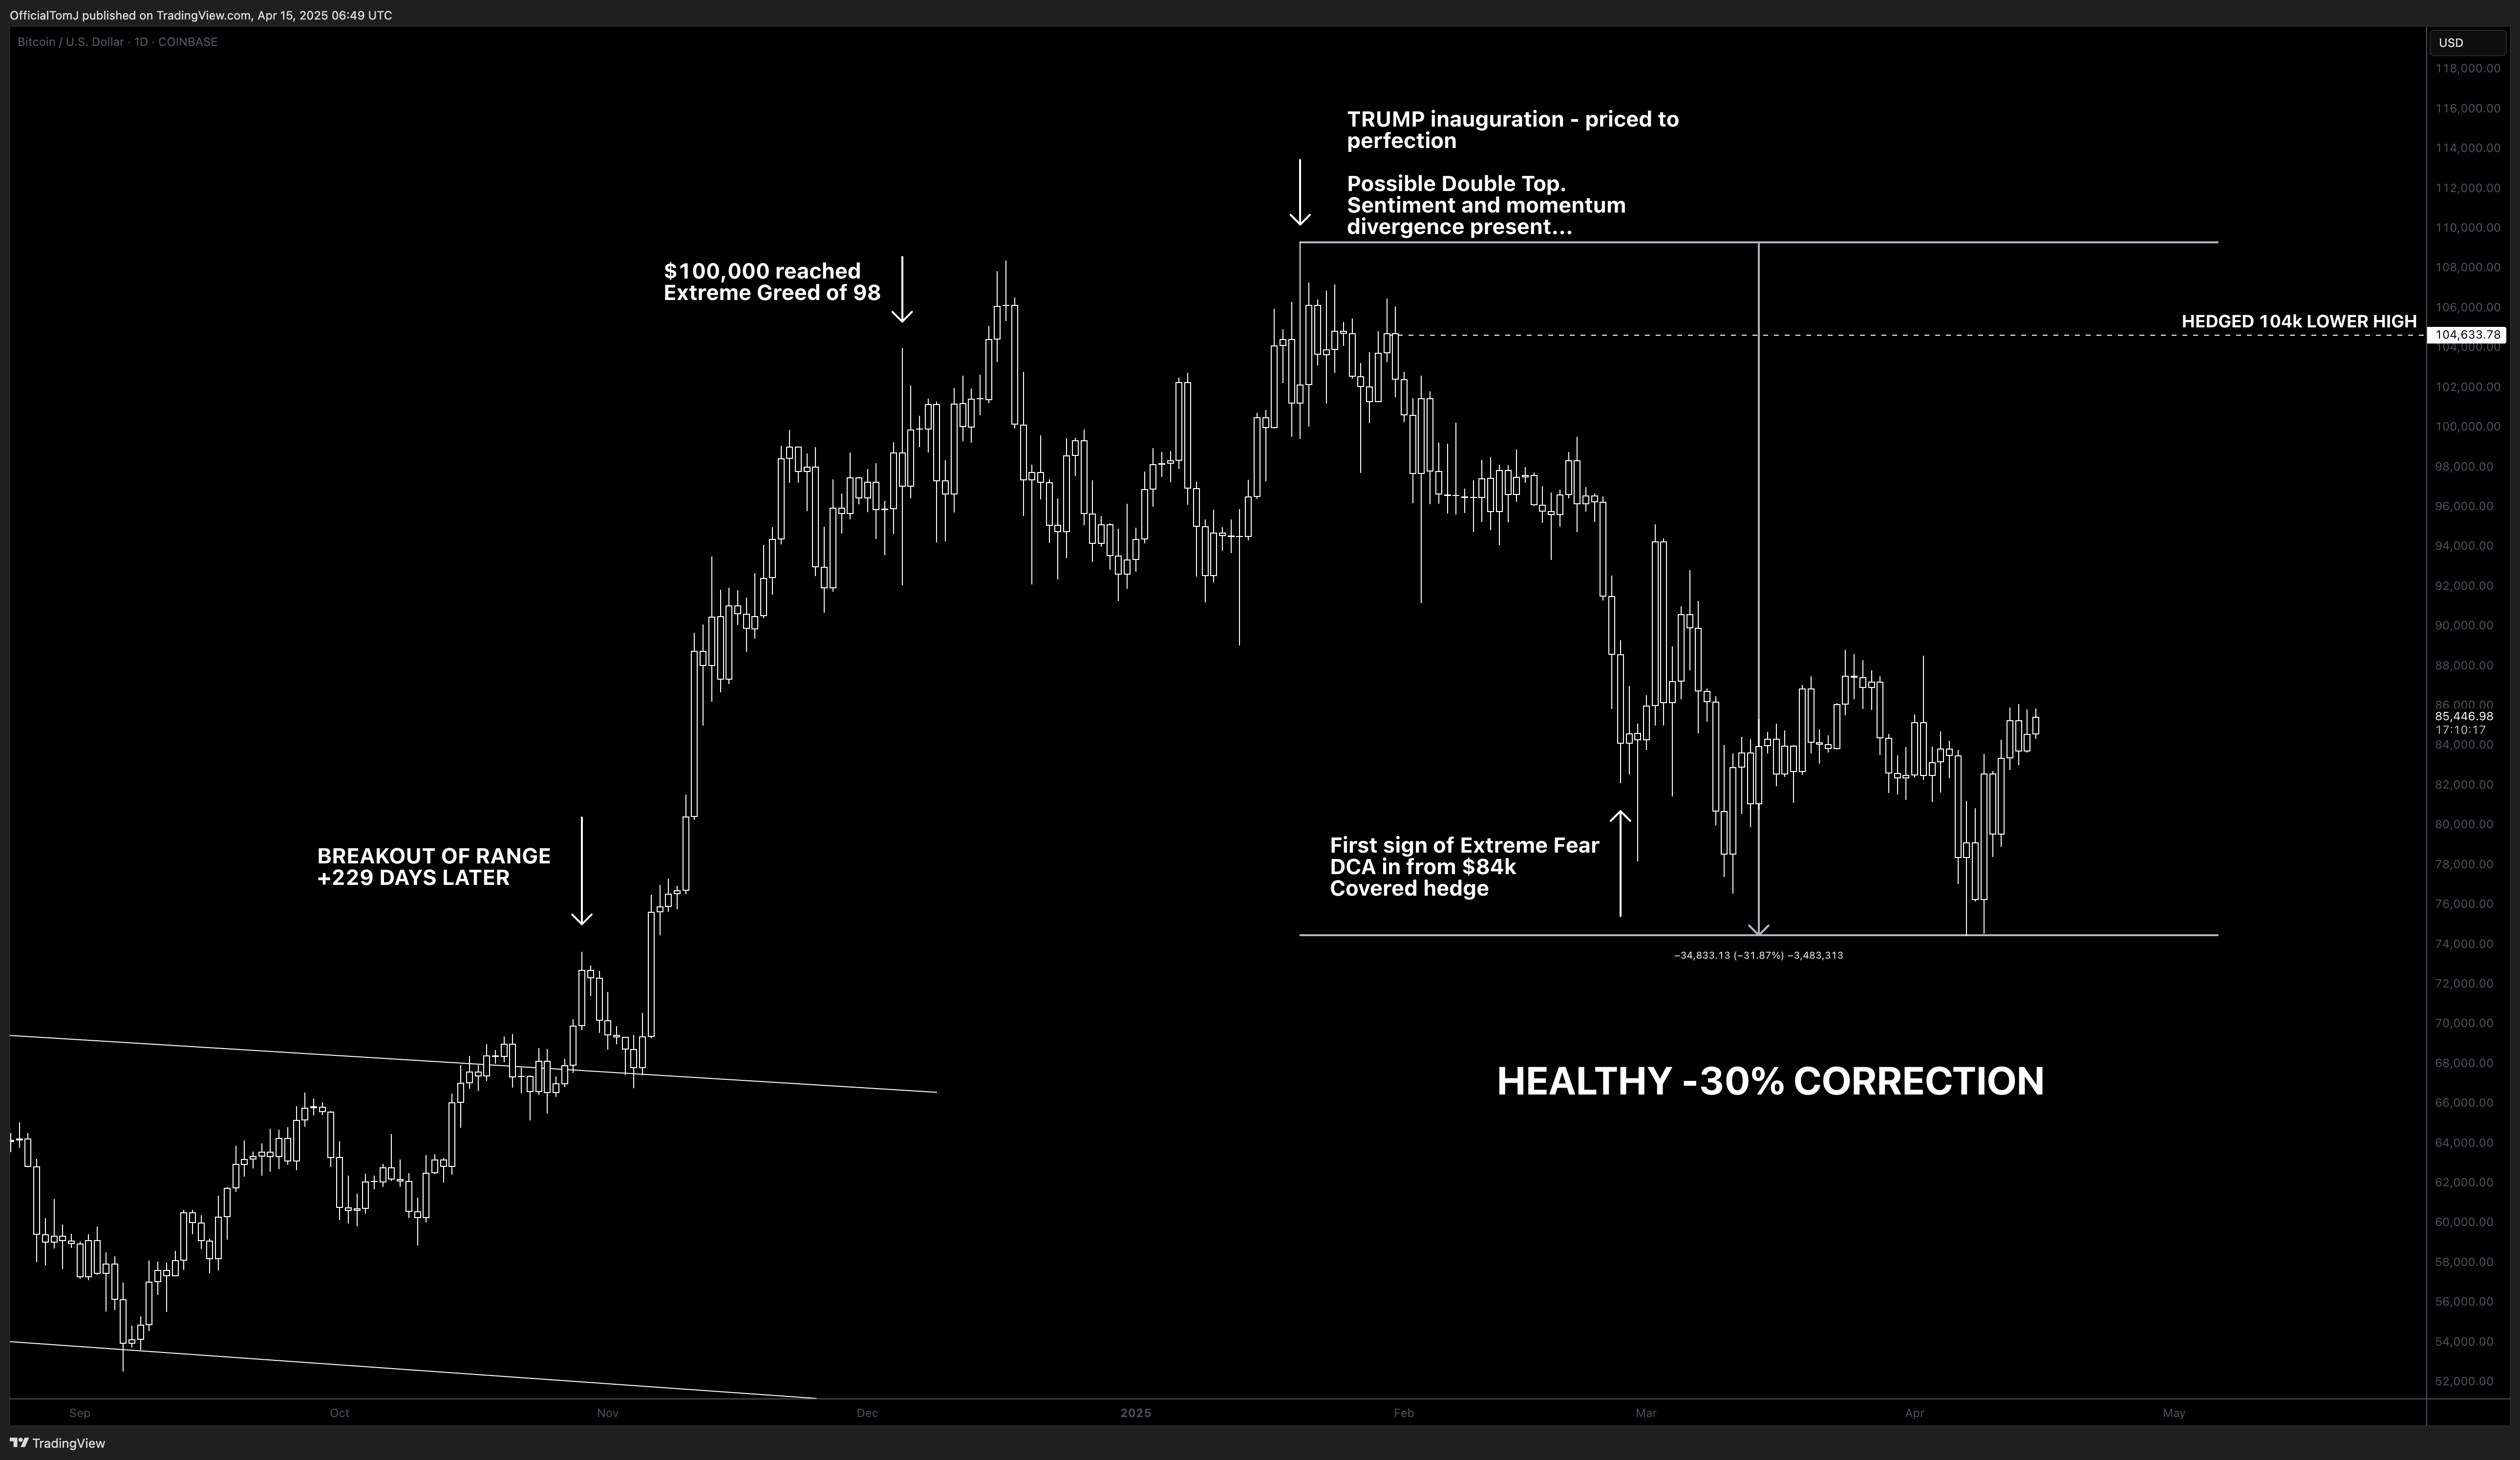
Following the collapse of Trump-related tokens, the memecoin sector saw the most severe losses, with many assets declining by over -90%. However, Bitcoin only experienced a -30% correction, managing to hold above key support levels. This divergence suggests that while speculative excess was flushed from the market, Bitcoin and other fundamentally strong assets remain in a structurally favourable position.
2. Are we still in a Bitcoin Bull Market?
After the recent correction, many are questioning whether Bitcoin and the broader crypto market remain in a long-term bull cycle. To assess this, we need to examine global liquidity conditions and Bitcoin’s high time frame (HTF) price action to determine if this pullback is a healthy correction from extreme greed or a complete trend reversal.
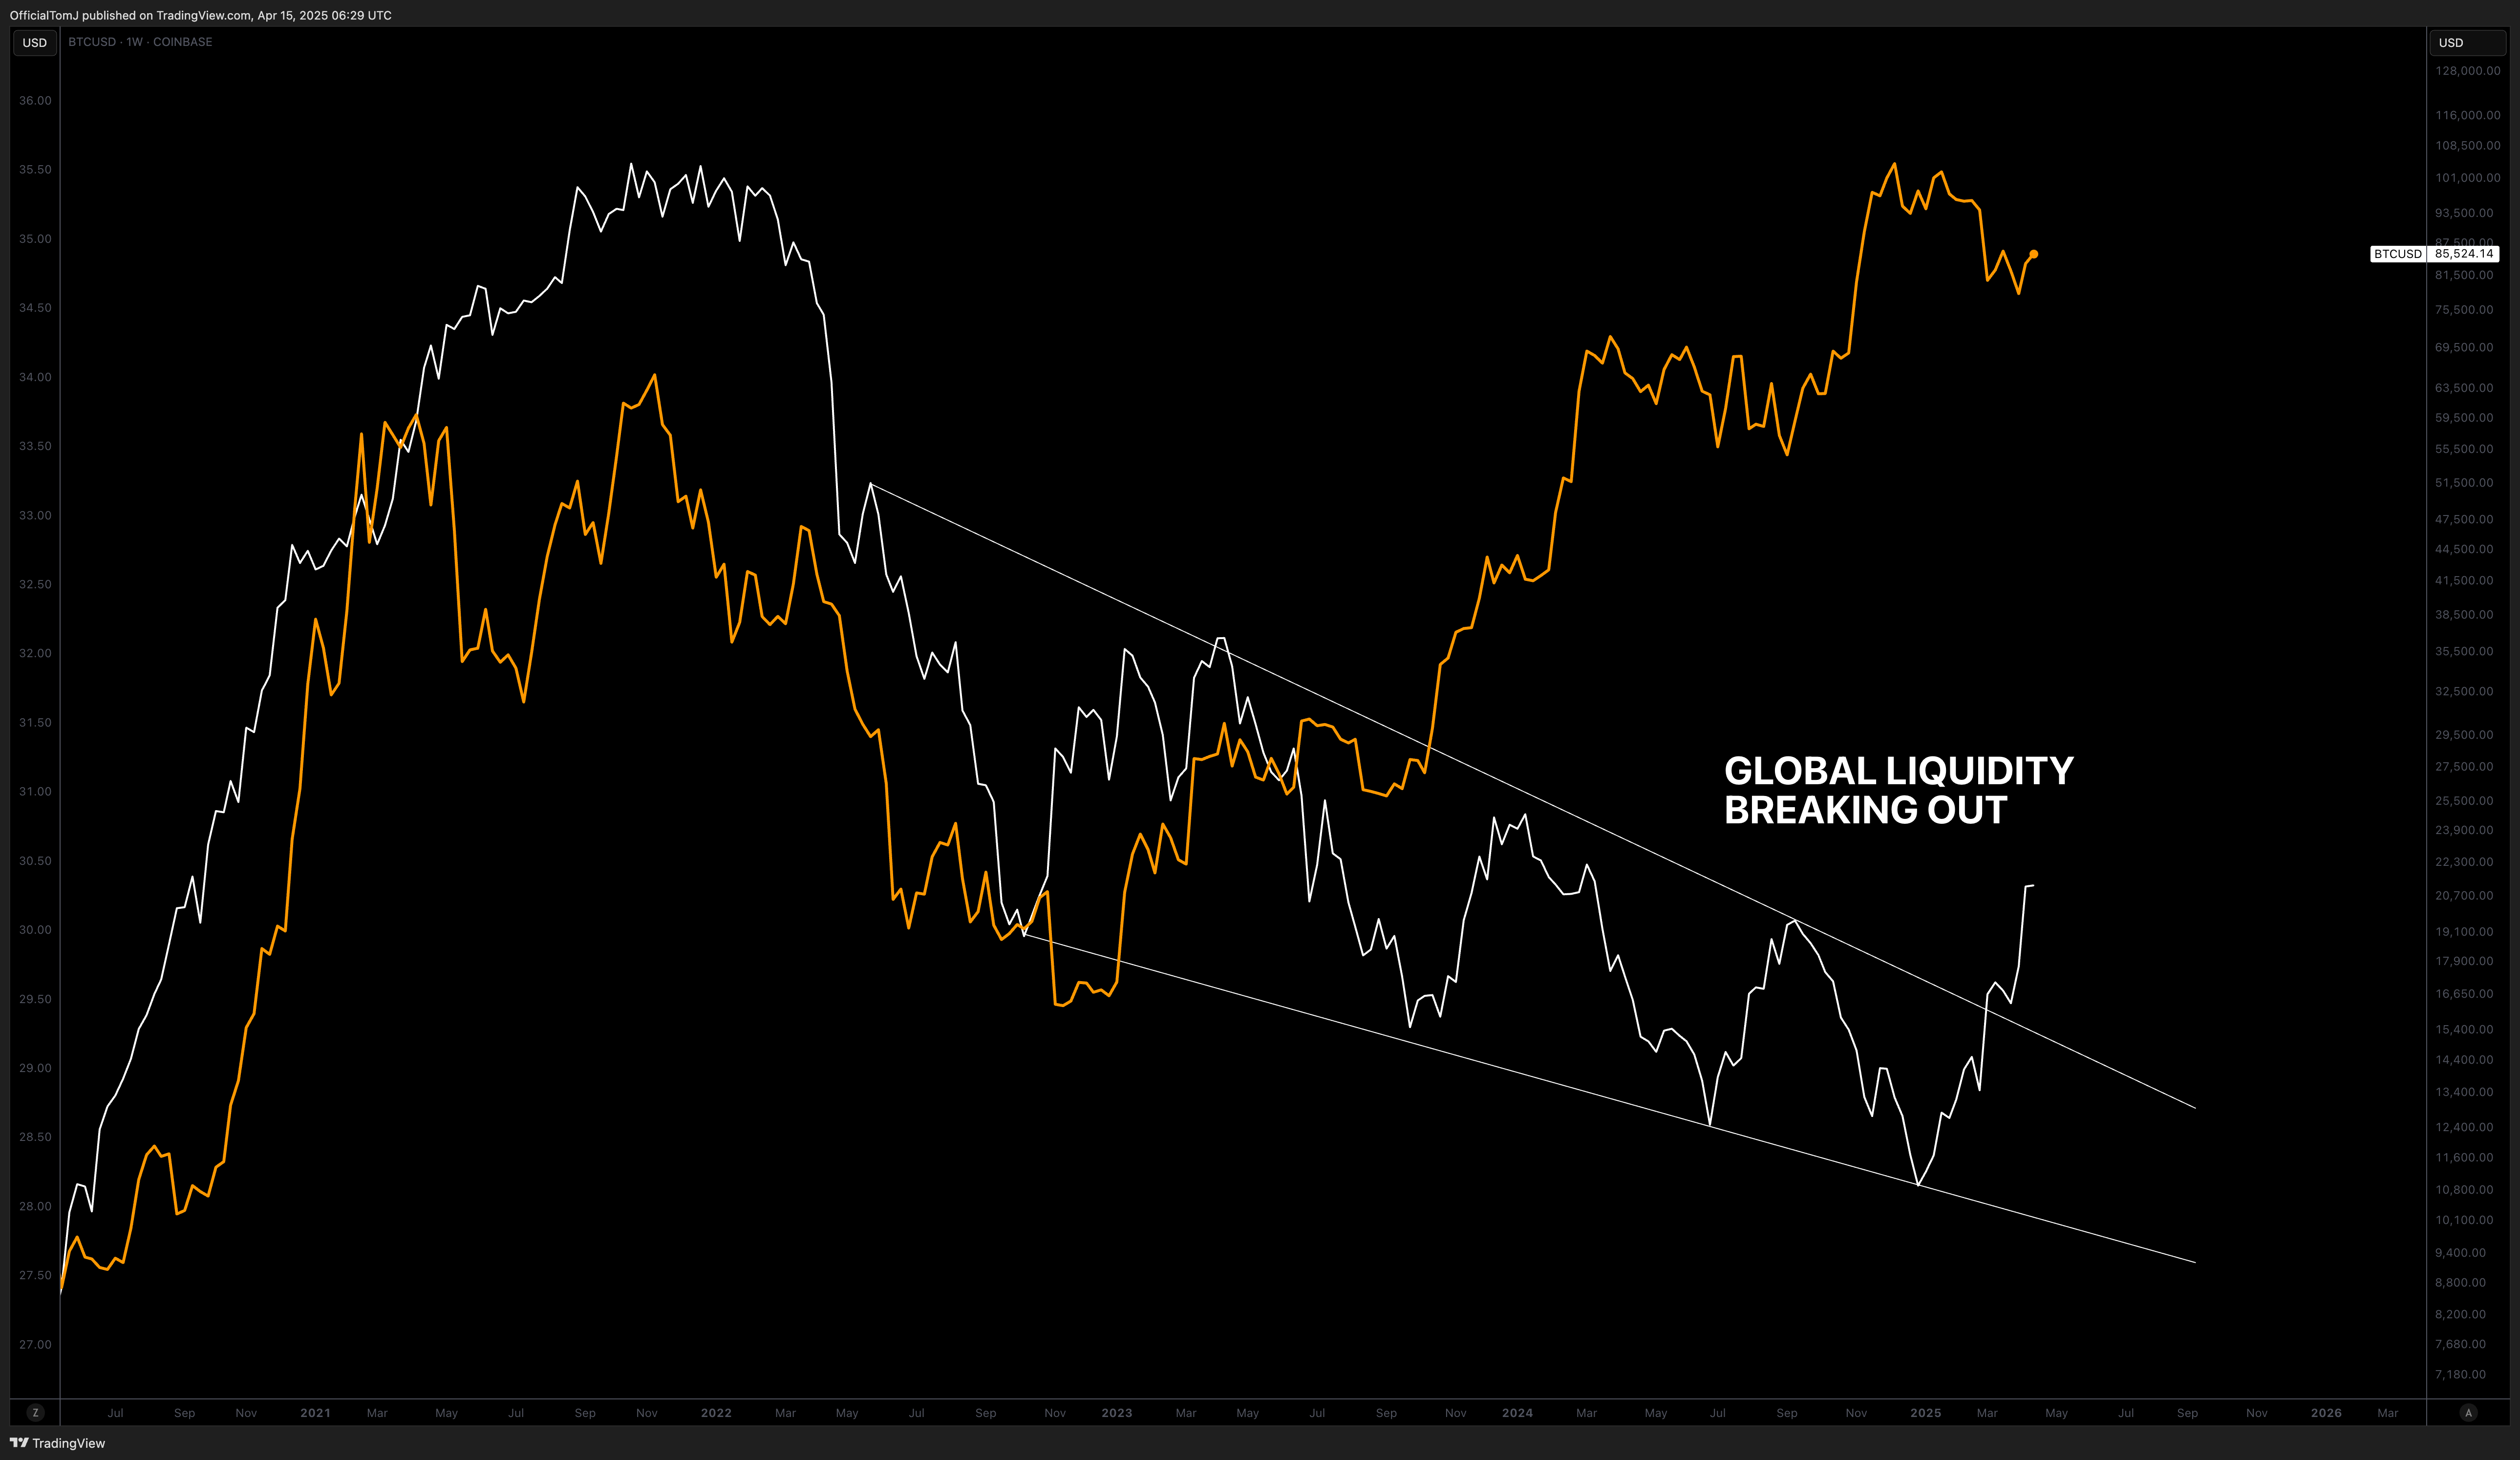
Global Liquidity Conditions
Since early 2022, the U.S. Federal Reserve has raised the federal funds rate from 0.08% to 4.33% as of March 2025, in response to post-COVID stimulus-induced inflation. Markets, being forward-looking, have anticipated easing monetary conditions, and as inflation remained elevated but was falling, Bitcoin rallied from $15,000 to over $84,000 during this current bull market (all while central bank balance sheets continued to decrease).
The Federal Reserve aims to promote maximum employment, stable prices, and moderate long-term interest rates. While it increased rates due to an overheating economy, it also has the capacity to decrease rates and provide stimulus in response to signs of weakness and rising unemployment. This is key for the next move higher in the bull cycle and what the Global Liquidity Index is signalling.
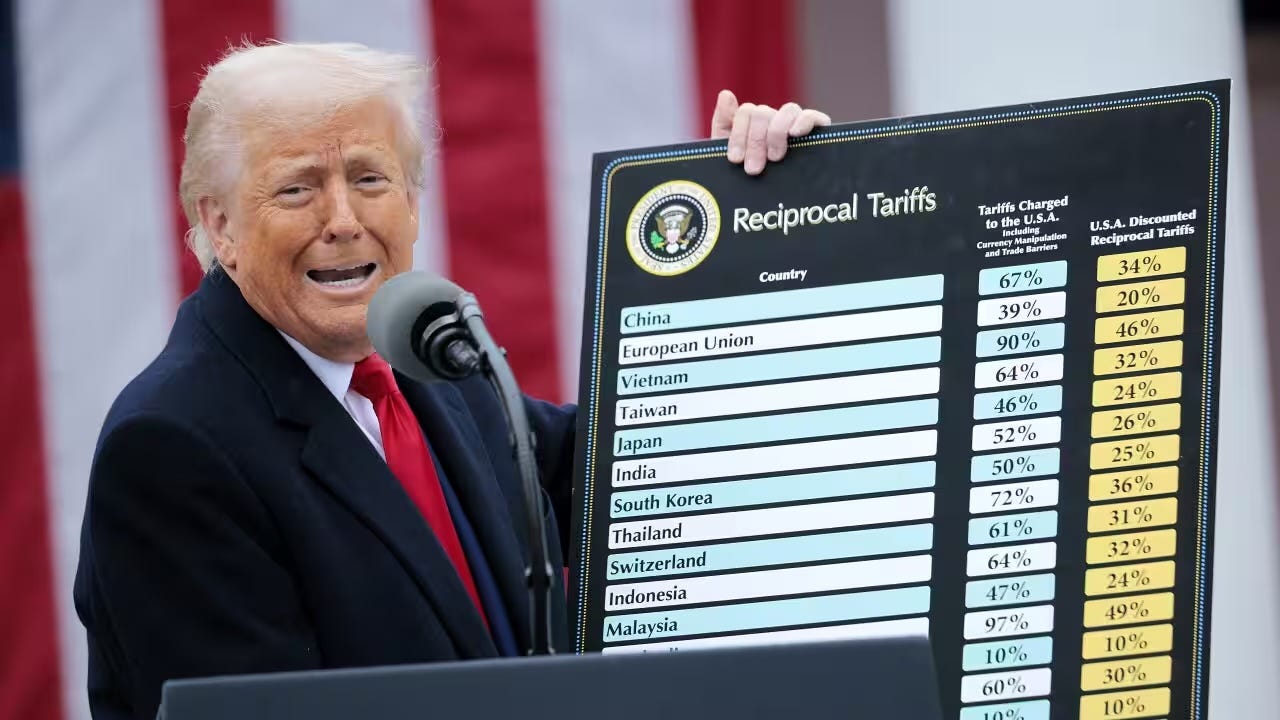
Tariffs and Market Volatility
Recent market volatility has been exacerbated by President Trump’s new tariff policies, which have repriced risk assets for lower growth and increased uncertainty. The risks of a recession have spiked towards 60% for 2025, and all eyes are on how the Federal Reserve will react to new data and tariffs. Will they maintain political neutrality, or will they respond to market volatility by providing stimulus?
Predicting short-term monetary policy actions is challenging. The best trades often come from identifying pivot points in policy and then riding the trend. In the longer term, we face significant growth risks and potential economic instability, which could have ramifications in 2026–2027.
However, for now, the Federal Reserve has tools at its disposal to ease liquidity conditions and potentially fuel the final expansion of the bull market before a significant change.
Gold. The Signal in the Noise
While most eyes are locked on equities, crypto, and rates… gold has been quietly screaming a message beneath the surface. And if you’re paying attention, the message is clear:
Currency debasement is coming.
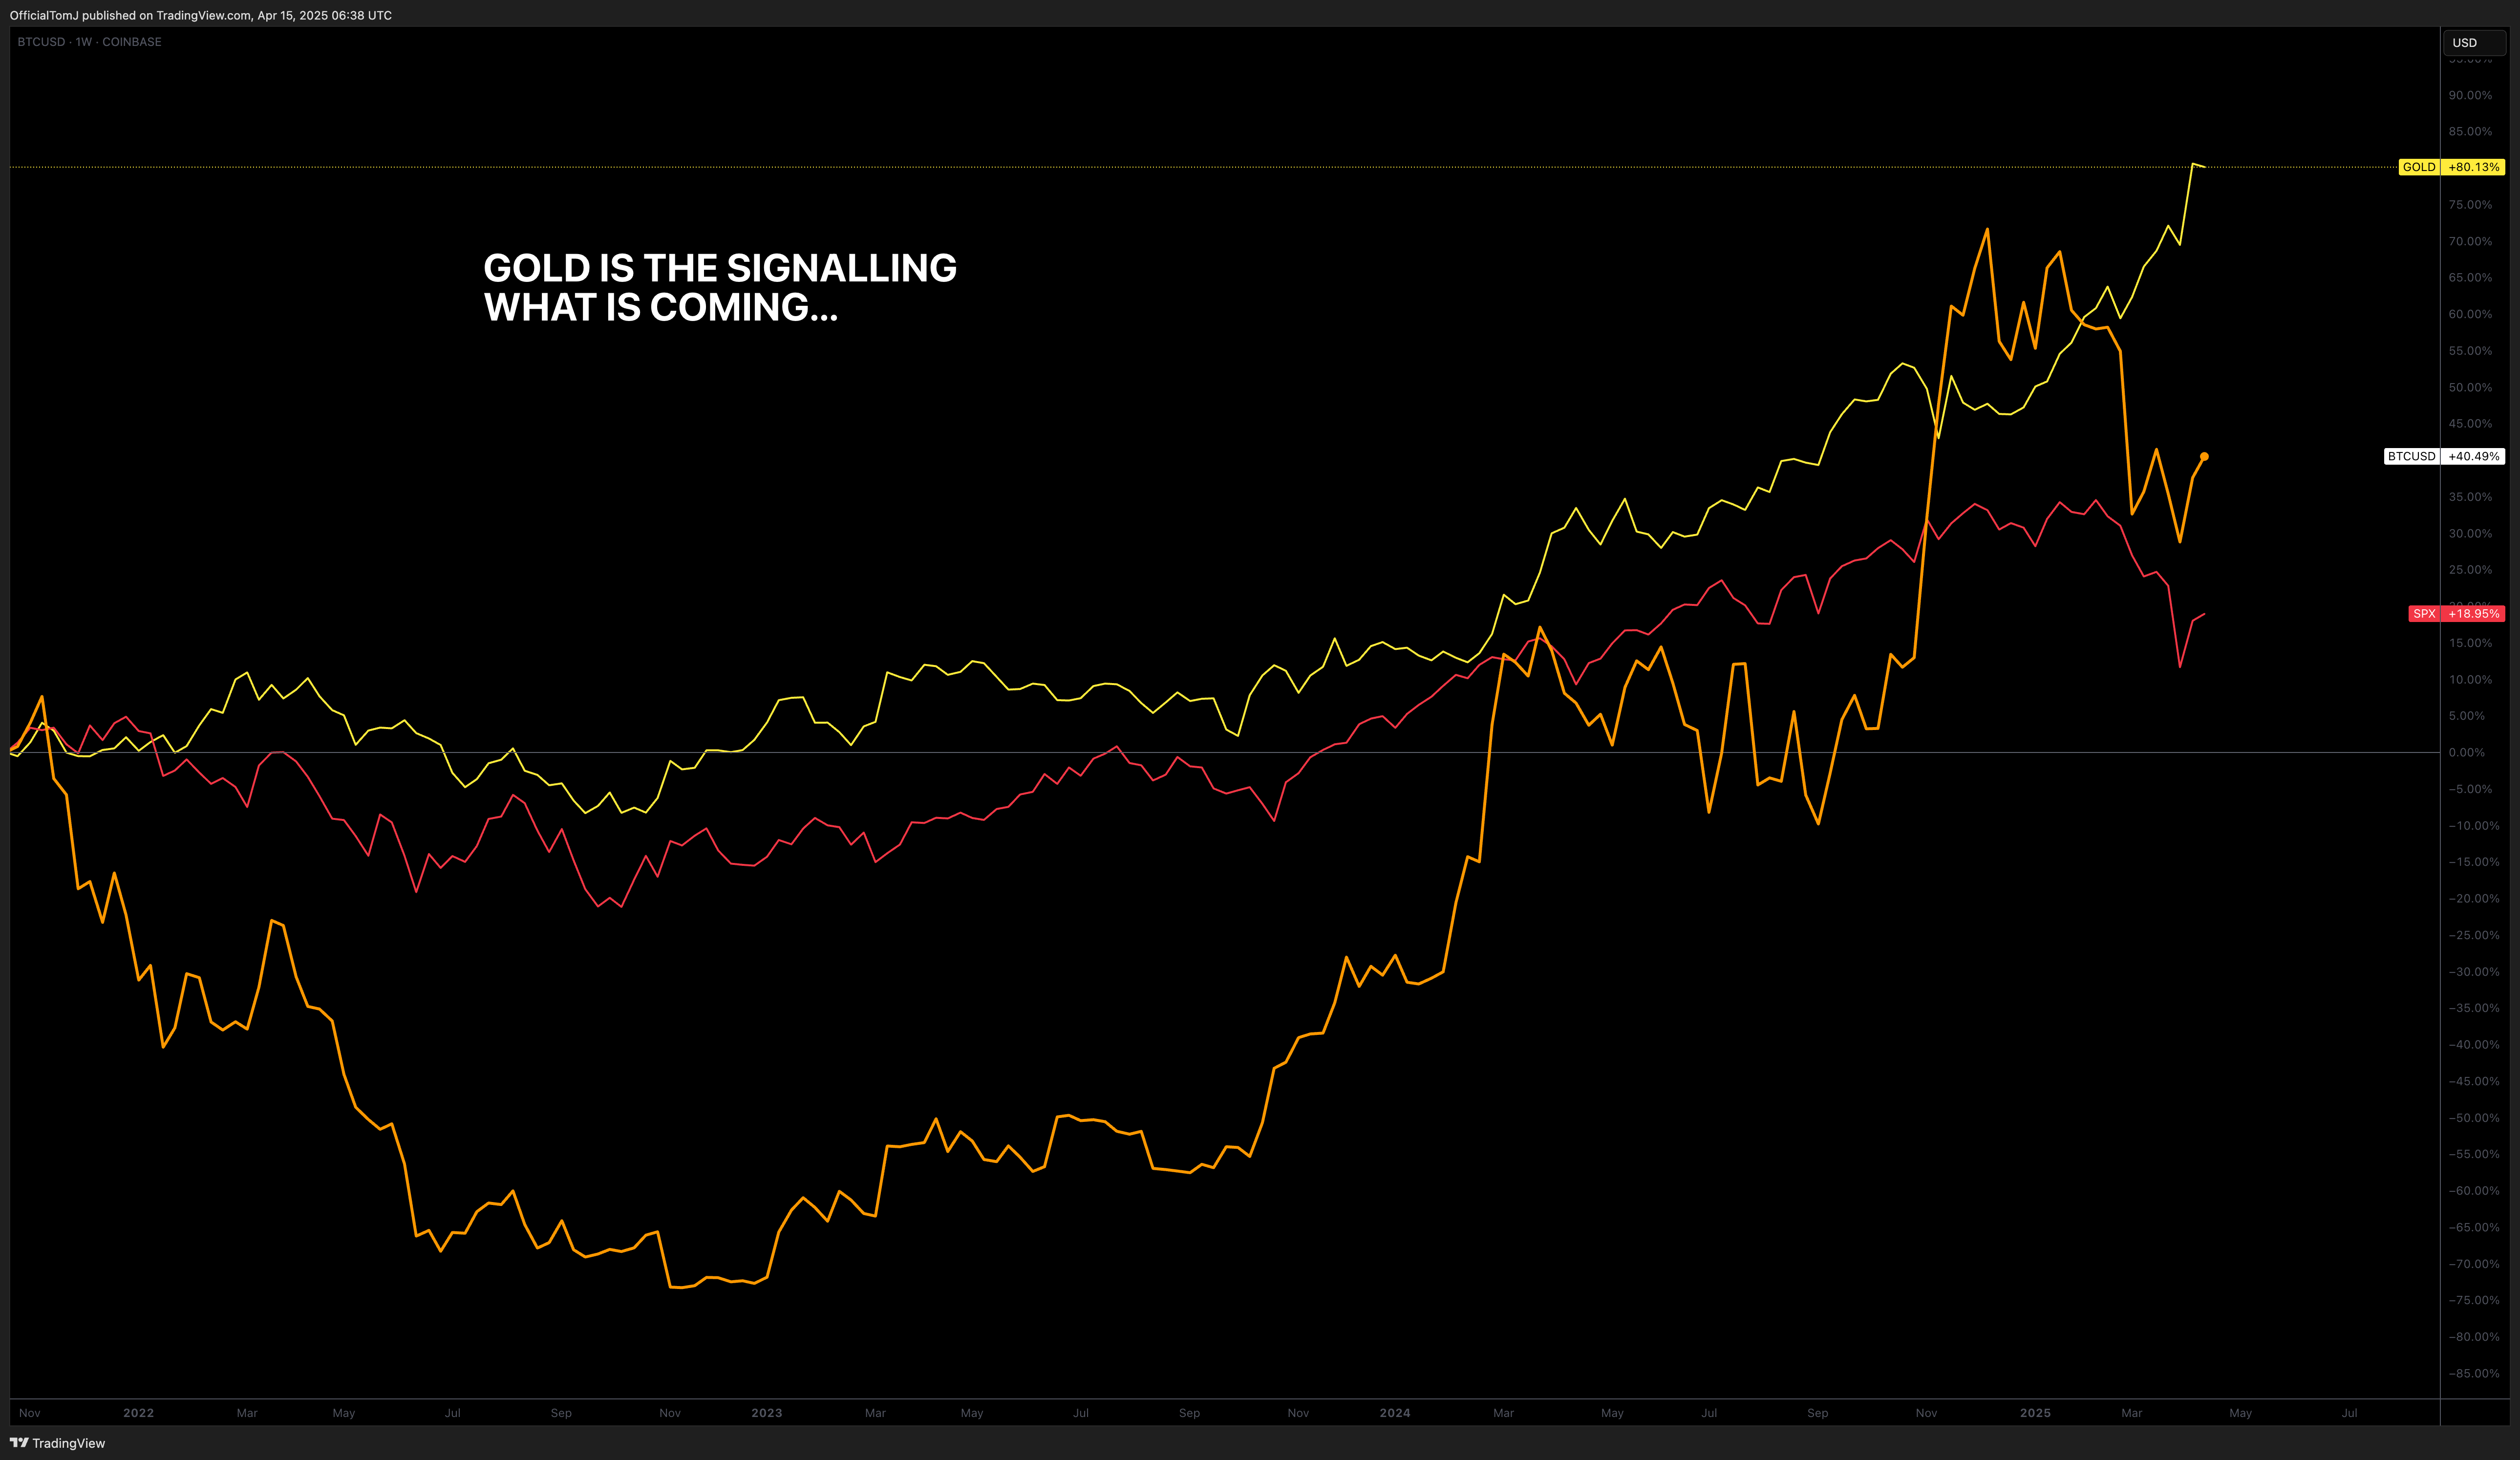
Since the 2024 U.S. election, gold has been on an absolute tear — maintaining a strong daily uptrend and recently breaking into new all-time highs above $3,200 per ounce, even as markets were rocked by tariffs and bond market volatility.
This isn’t just a reaction to macro drama — this is a leading indicator of something deeper brewing.
“Where There’s Smoke, There’s Fire”
Whenever you see a traditionally slow-moving asset like gold move this aggressively, you have to ask: what’s it front-running?
My take: the gold rally is pricing in the inevitable pivot toward easing and an increasing probability of currency debasement — both from the U.S. and potentially other G7 nations under financial strain. Add in the return of geopolitical risk, cracks in the bond market, and a Fed that’s walking a tightrope — and gold starts to make a lot of sense as a defensive hedge.
Gold doesn’t lie. It doesn’t meme. And it’s not chasing narratives.
It just reacts — often before anything else does.
Expectation
We anticipate an easing of liquidity conditions to stimulate asset markets into new highs for 2025 and possibly 2026, before a significant correction and the onset of the next bear market.
In summary, while the recent correction has shaken confidence, the broader macroeconomic indicators suggest that the crypto bull market remains intact, albeit with caution warranted due to potential policy shifts and economic headwinds.
3. The Higher Time Frame Correction
Now that we’ve unpacked the macro catalysts behind the correction, let’s zoom out and analyse what the charts are actually telling us. Because at the end of the day, no matter what the headlines say — price is truth.
If you’ve been following me for a while, you’ll know this has always been my north star: understanding price action through market structure and crowd behavior, not noise. And what the current structure is showing… is actually not that bearish at all.
Let’s dive into the higher time frame (HTF) price action and break down where we are in the current market cycle.
Recap of the Previous Run
The last major leg up began when BTC flipped bullish at $60,000, breaking cleanly through resistance and charging toward six figures. We topped out at $108,000 before forming a double top — a classic sign of exhaustion. That deceleration led to a broad correction that officially turned bearish on the daily timeframe as of February 7th.
From the $108K high, price dropped sharply, bottoming at $74,200 — right as “Liberation Day” and Trump’s tariff announcements rattled global markets. But despite the noise, BTC has held up remarkably well.
$78,000 has acted as a crucial support level, and this pullback so far has been a -32% correction — well within the bounds of a healthy Bitcoin bull market. For reference, 30–40% dips are not just normal in BTC cycles — they’re expected.
Key Support Levels Still Intact
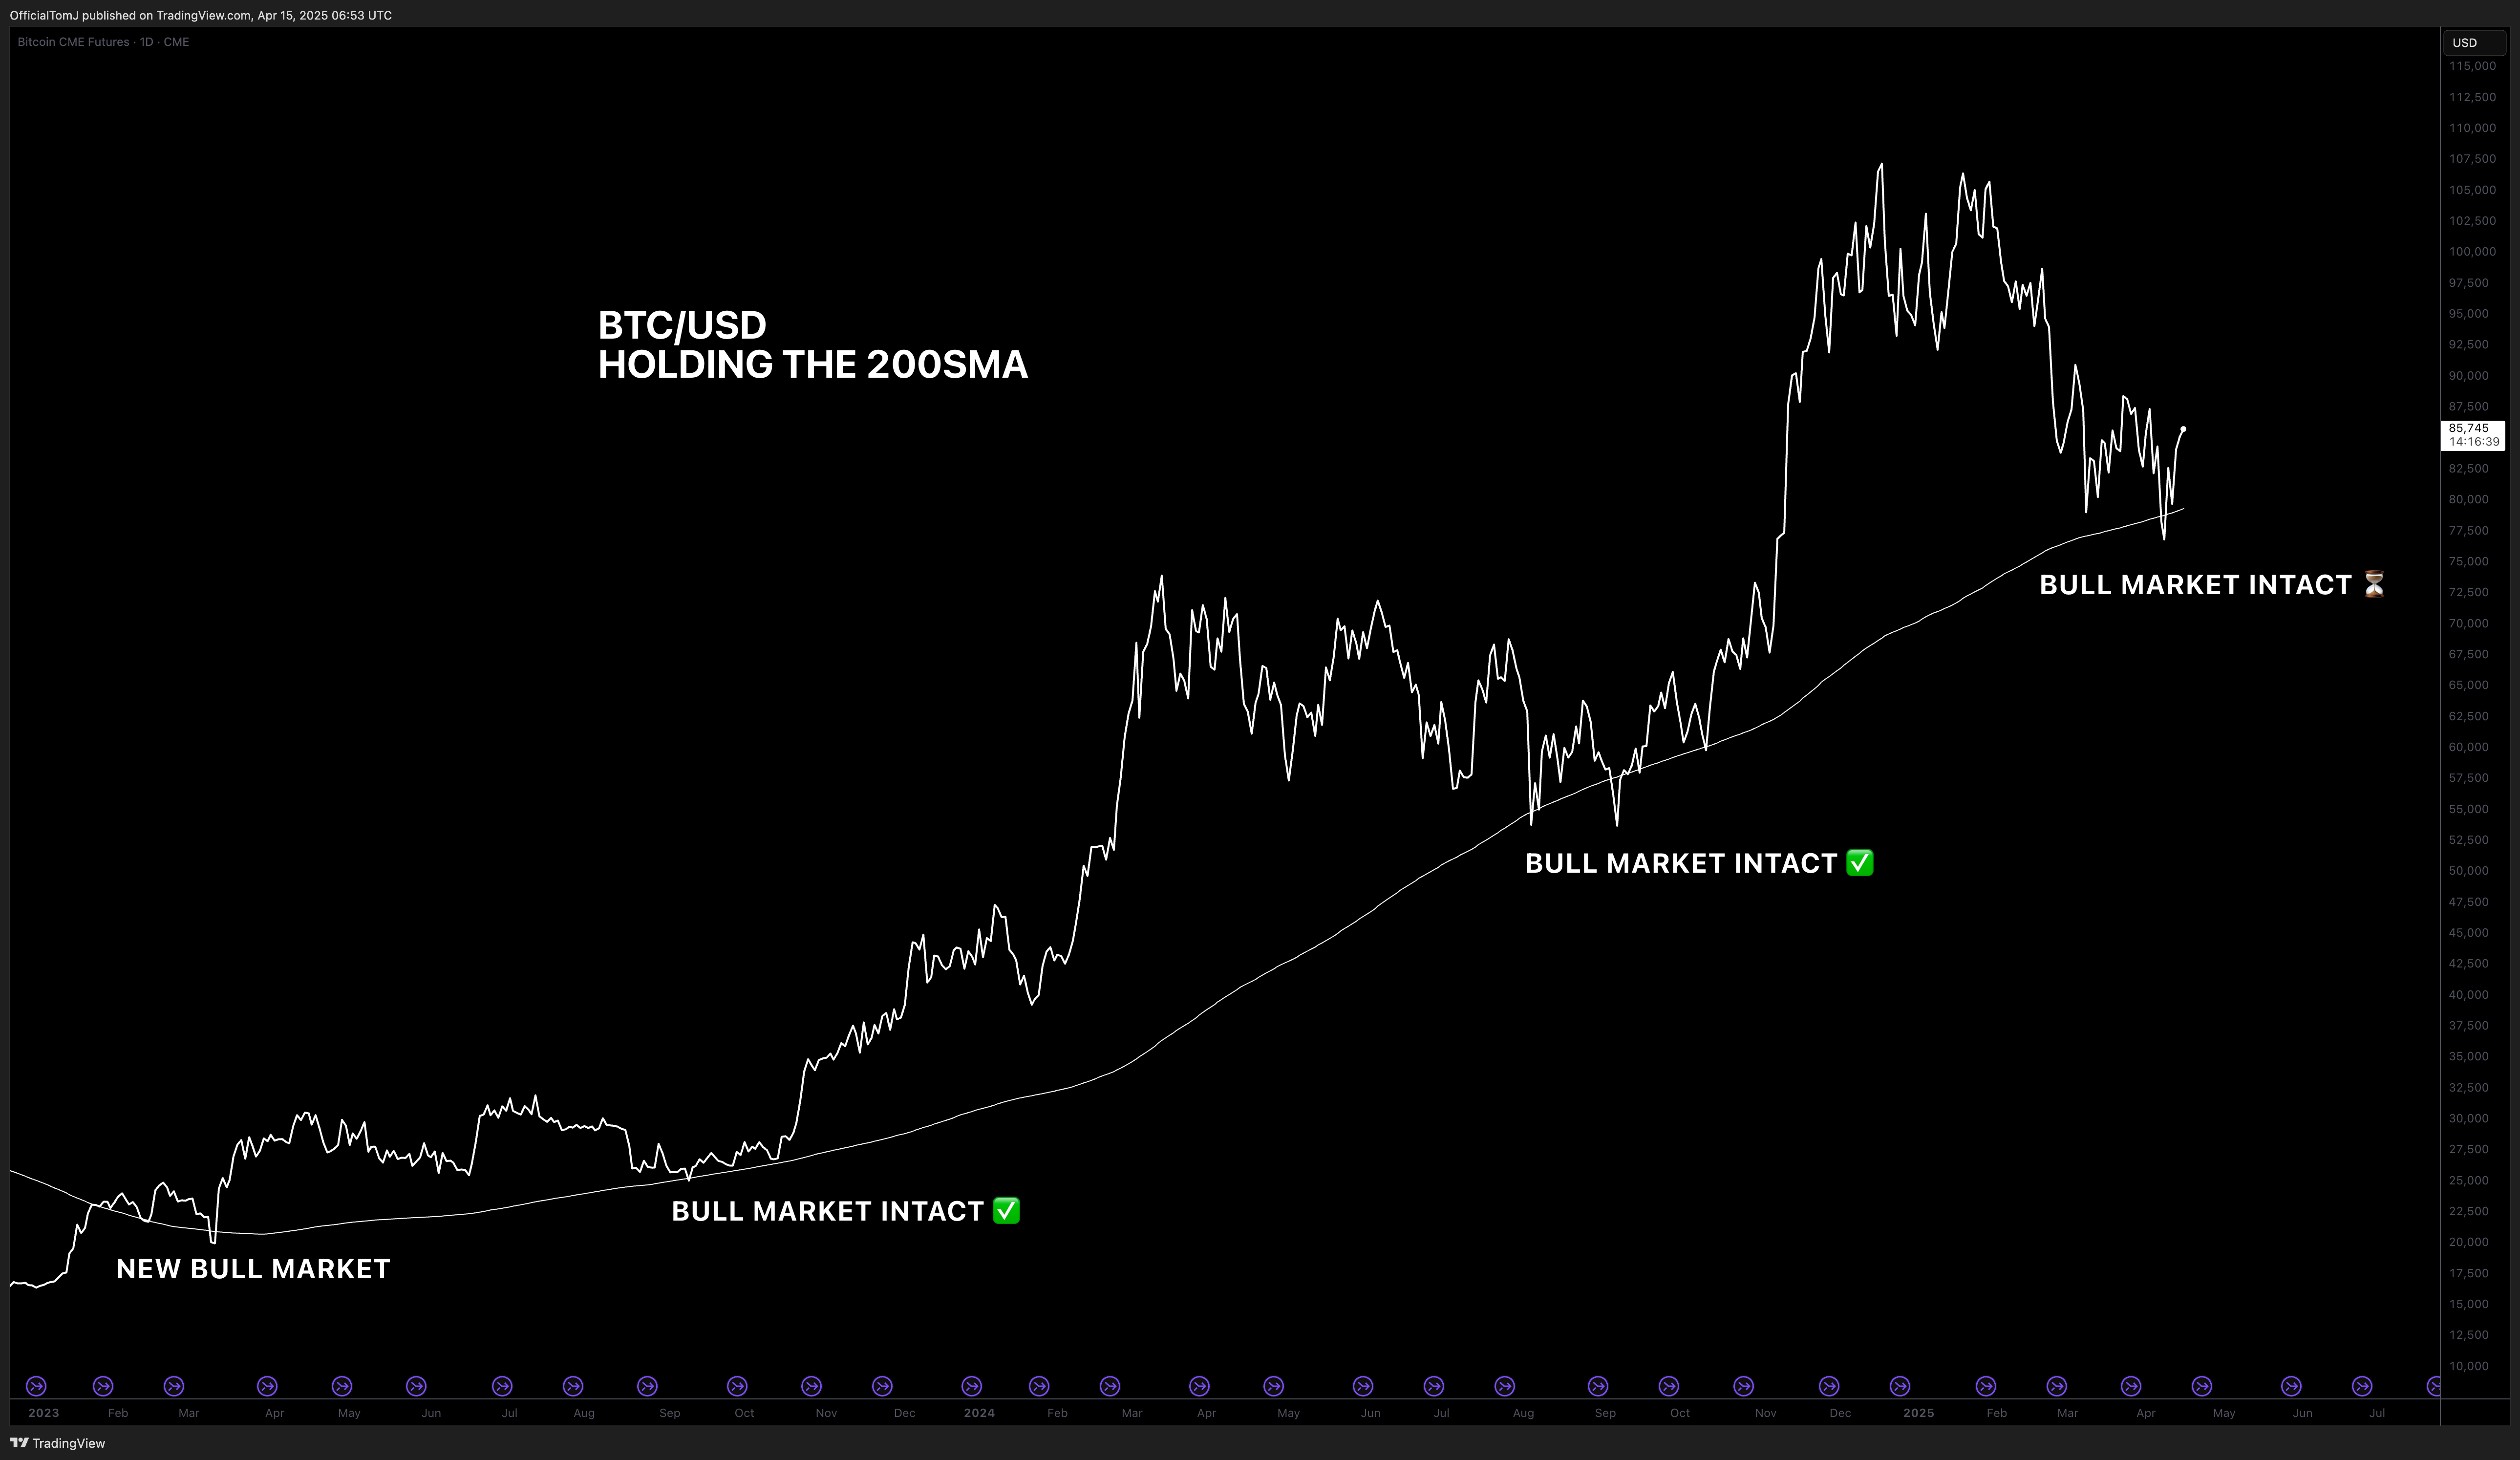
Even though the daily EMAs have flipped to resistance, the weekly 50EMA — one of the most reliable bull market trend indicators — remains intact. More importantly, the 200SMA on the Bitcoin CME Futures chart is still acting as support. This tells us that the macro structure has not broken down.
However, we are on watch: if BTC closes below the weekly low at $54,000, the HTF bull thesis is invalidated. That’s the final line in the sand.
The Daily Chart: Bearish, But Not Broken
On the Daily timeframe, we’re still in a short-term bearish structure. The D50 (Daily 50EMA) is currently being treated as resistance. For BTC to reclaim momentum, we need to see:
• A clear push back above $88,000 (the last lower high),
• A reclaim of the D50 as support,
• And a follow-through rally toward the psychological $100K mark.
That’s when we can talk about acceleration into new ATHs.
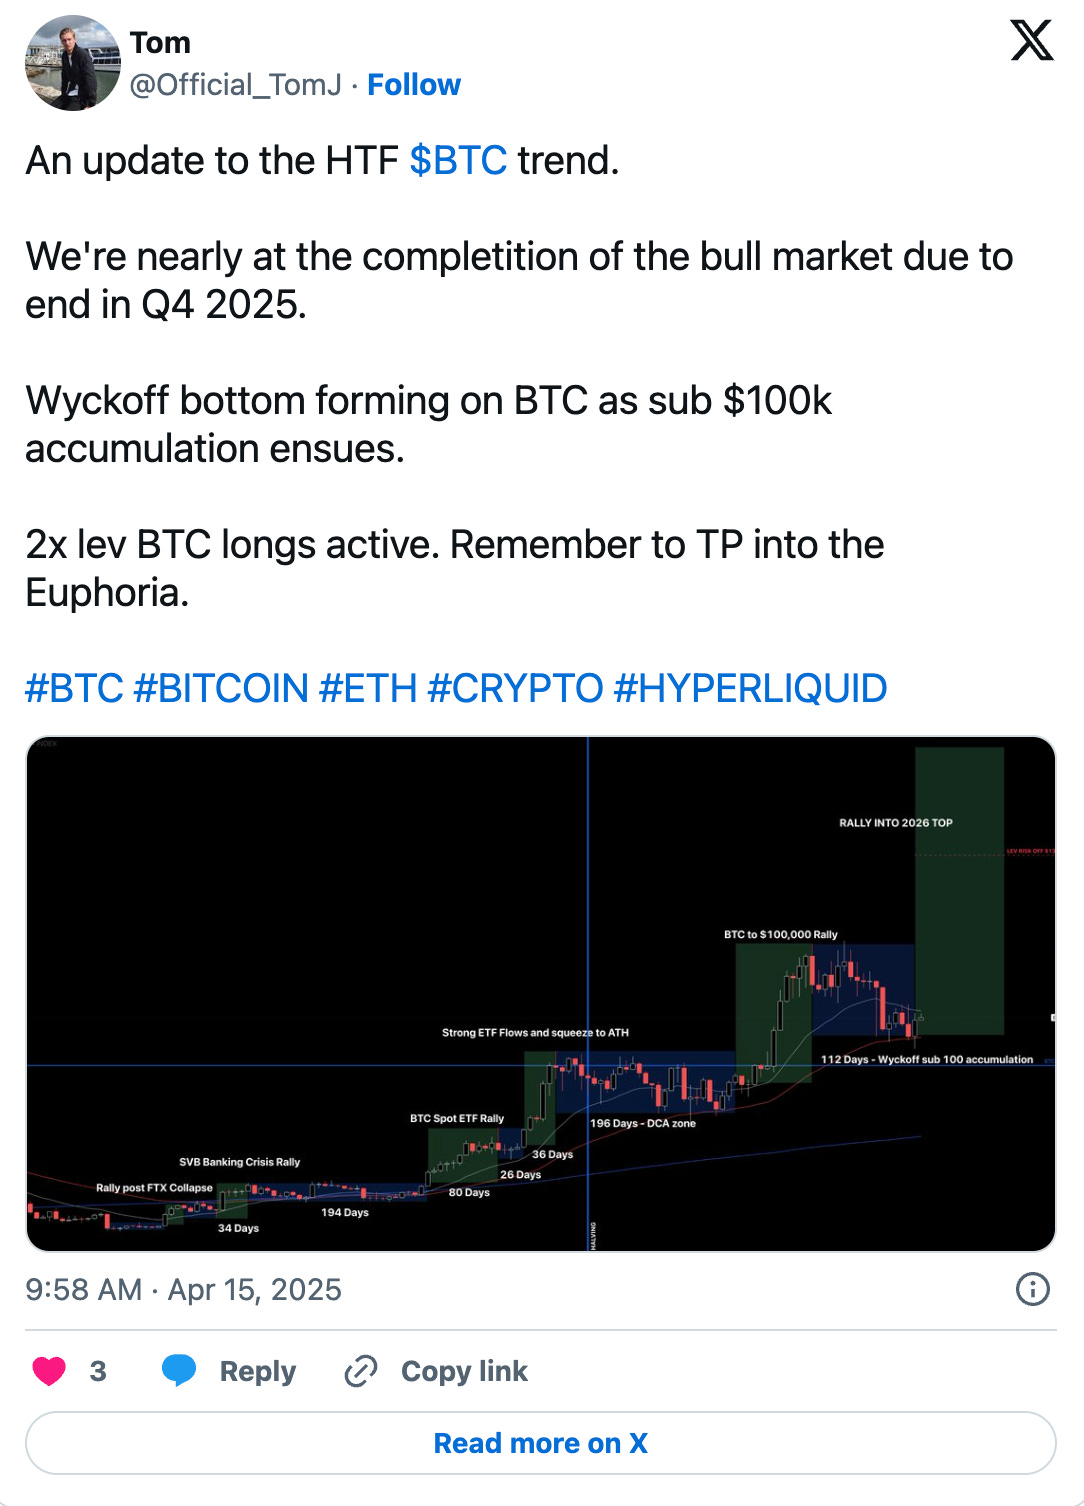
But here’s where it gets interesting — we’ve been spotting clear signs of Wyckoff Accumulation on the Daily.
Wyckoff Structure: Spring Has Sprung?
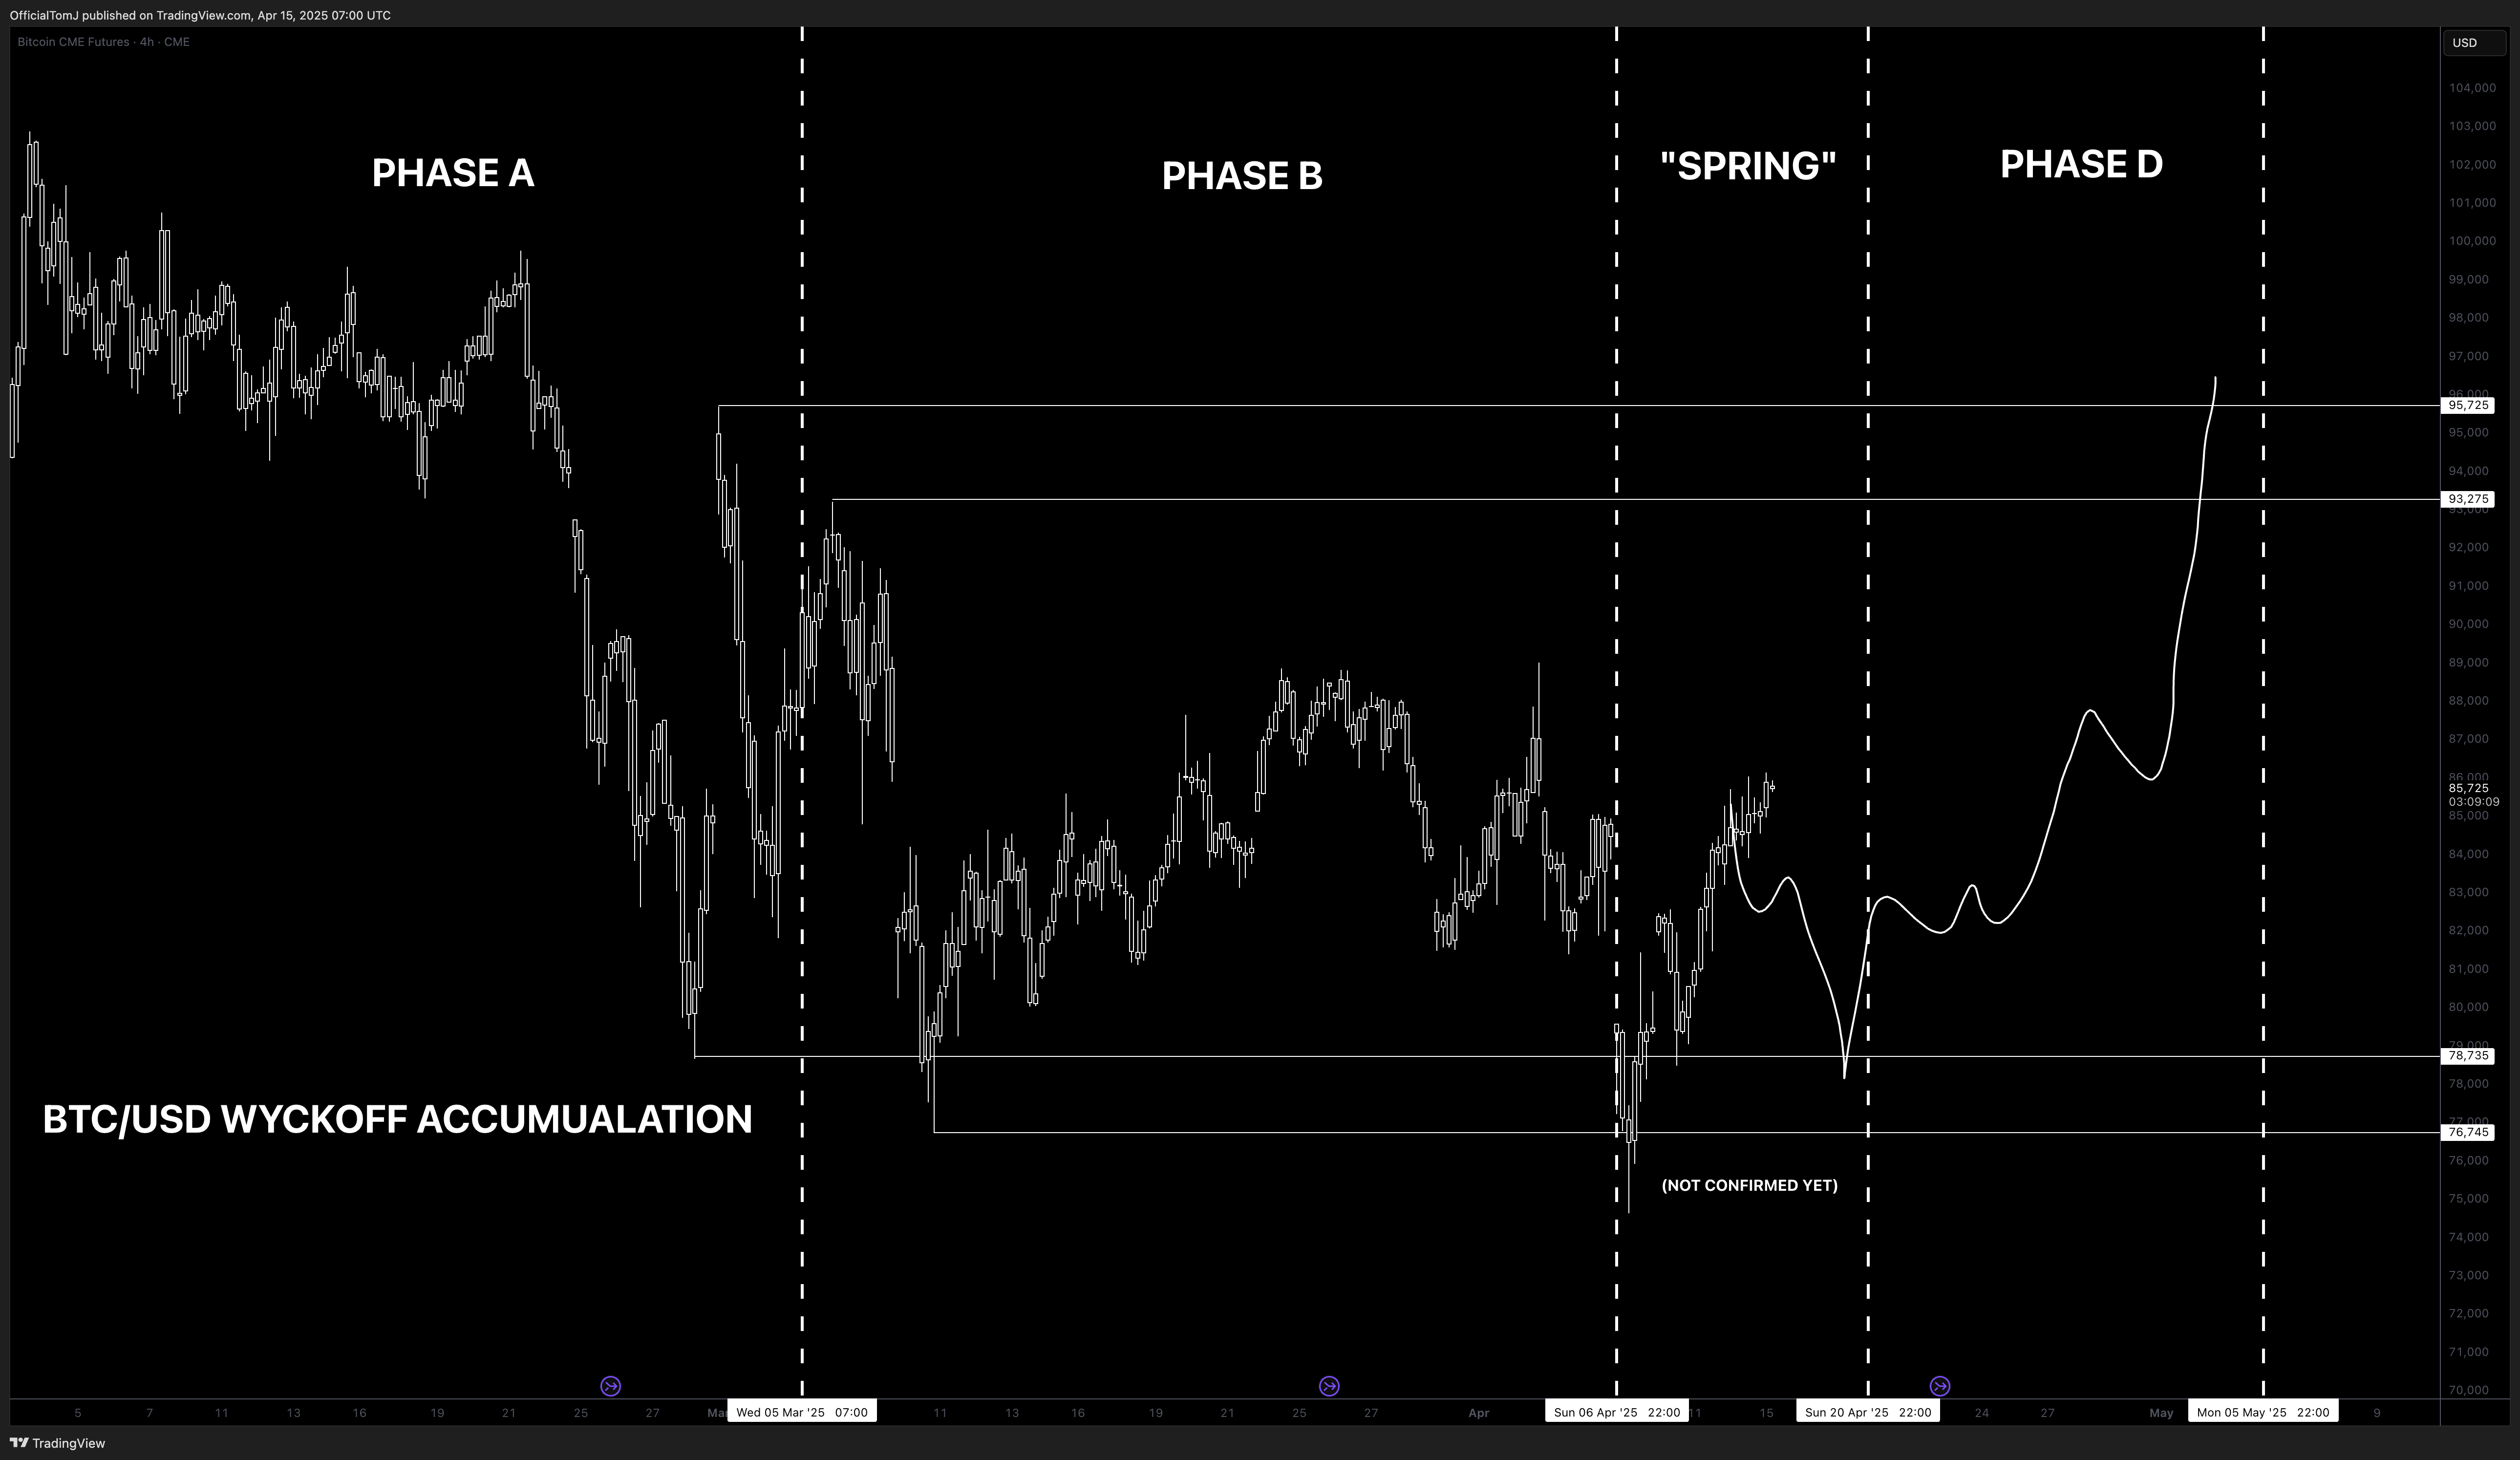
The final spring — the shakeout that traps late sellers and absorbs the last supply — may have just occurred. This is the moment where markets look their weakest… right before they rip.
Based on the current structure, BTC may still see another panic wick lower (likely to the $70K region) if liquidation flows pick up. But structurally, this looks more like smart money accumulation than trend reversal.
And if Wyckoff continues to play out, this consolidation below $100,000 could be setting the stage for the next expansion leg higher.
You can read and learn more about the Wyckoff market theory and patterns here: https://www.wyckoffanalytics.com/wyckoff-method/
Expectation
Here’s the base case I’m working with right now:
• Bitcoin is bottoming in the classic 30–40% correction range.
• We are in a Wyckoff accumulation phase — a textbook healthy pause before continuation.
• The next upside target is $137,000, with an extended bull case of up to $172,000 if conditions align.
Short-term fear has flushed out the weak hands. But structurally, the bulls are still in control.
4. The TJSS Method. And current portfolio update.
Let’s talk strategy.
This current phase in the market is where the Thomas Johnston Spot Swing Method (TJSS) really comes alive. For those new here — the TJSS Method is my personal trading framework designed to capture the most profitable swings in a Bitcoin bull market. It’s not about catching every move, but about catching the right ones — the emotionally charged extremes where the majority are either too euphoric or too fearful to act rationally.
Right now? We’re in one of those moments.
Short Summary: How the TJSS Method Works
TJSS is built on a simple but powerful philosophy: ride the sentiment swings with confluence.
It filters the market into two clear signals:
• STRONG BUY during Extreme Fear and technical bottoming
• STRONG SELL during Extreme Greed and technical exhaustion
At this moment, all major signals are flashing STRONG BUY:
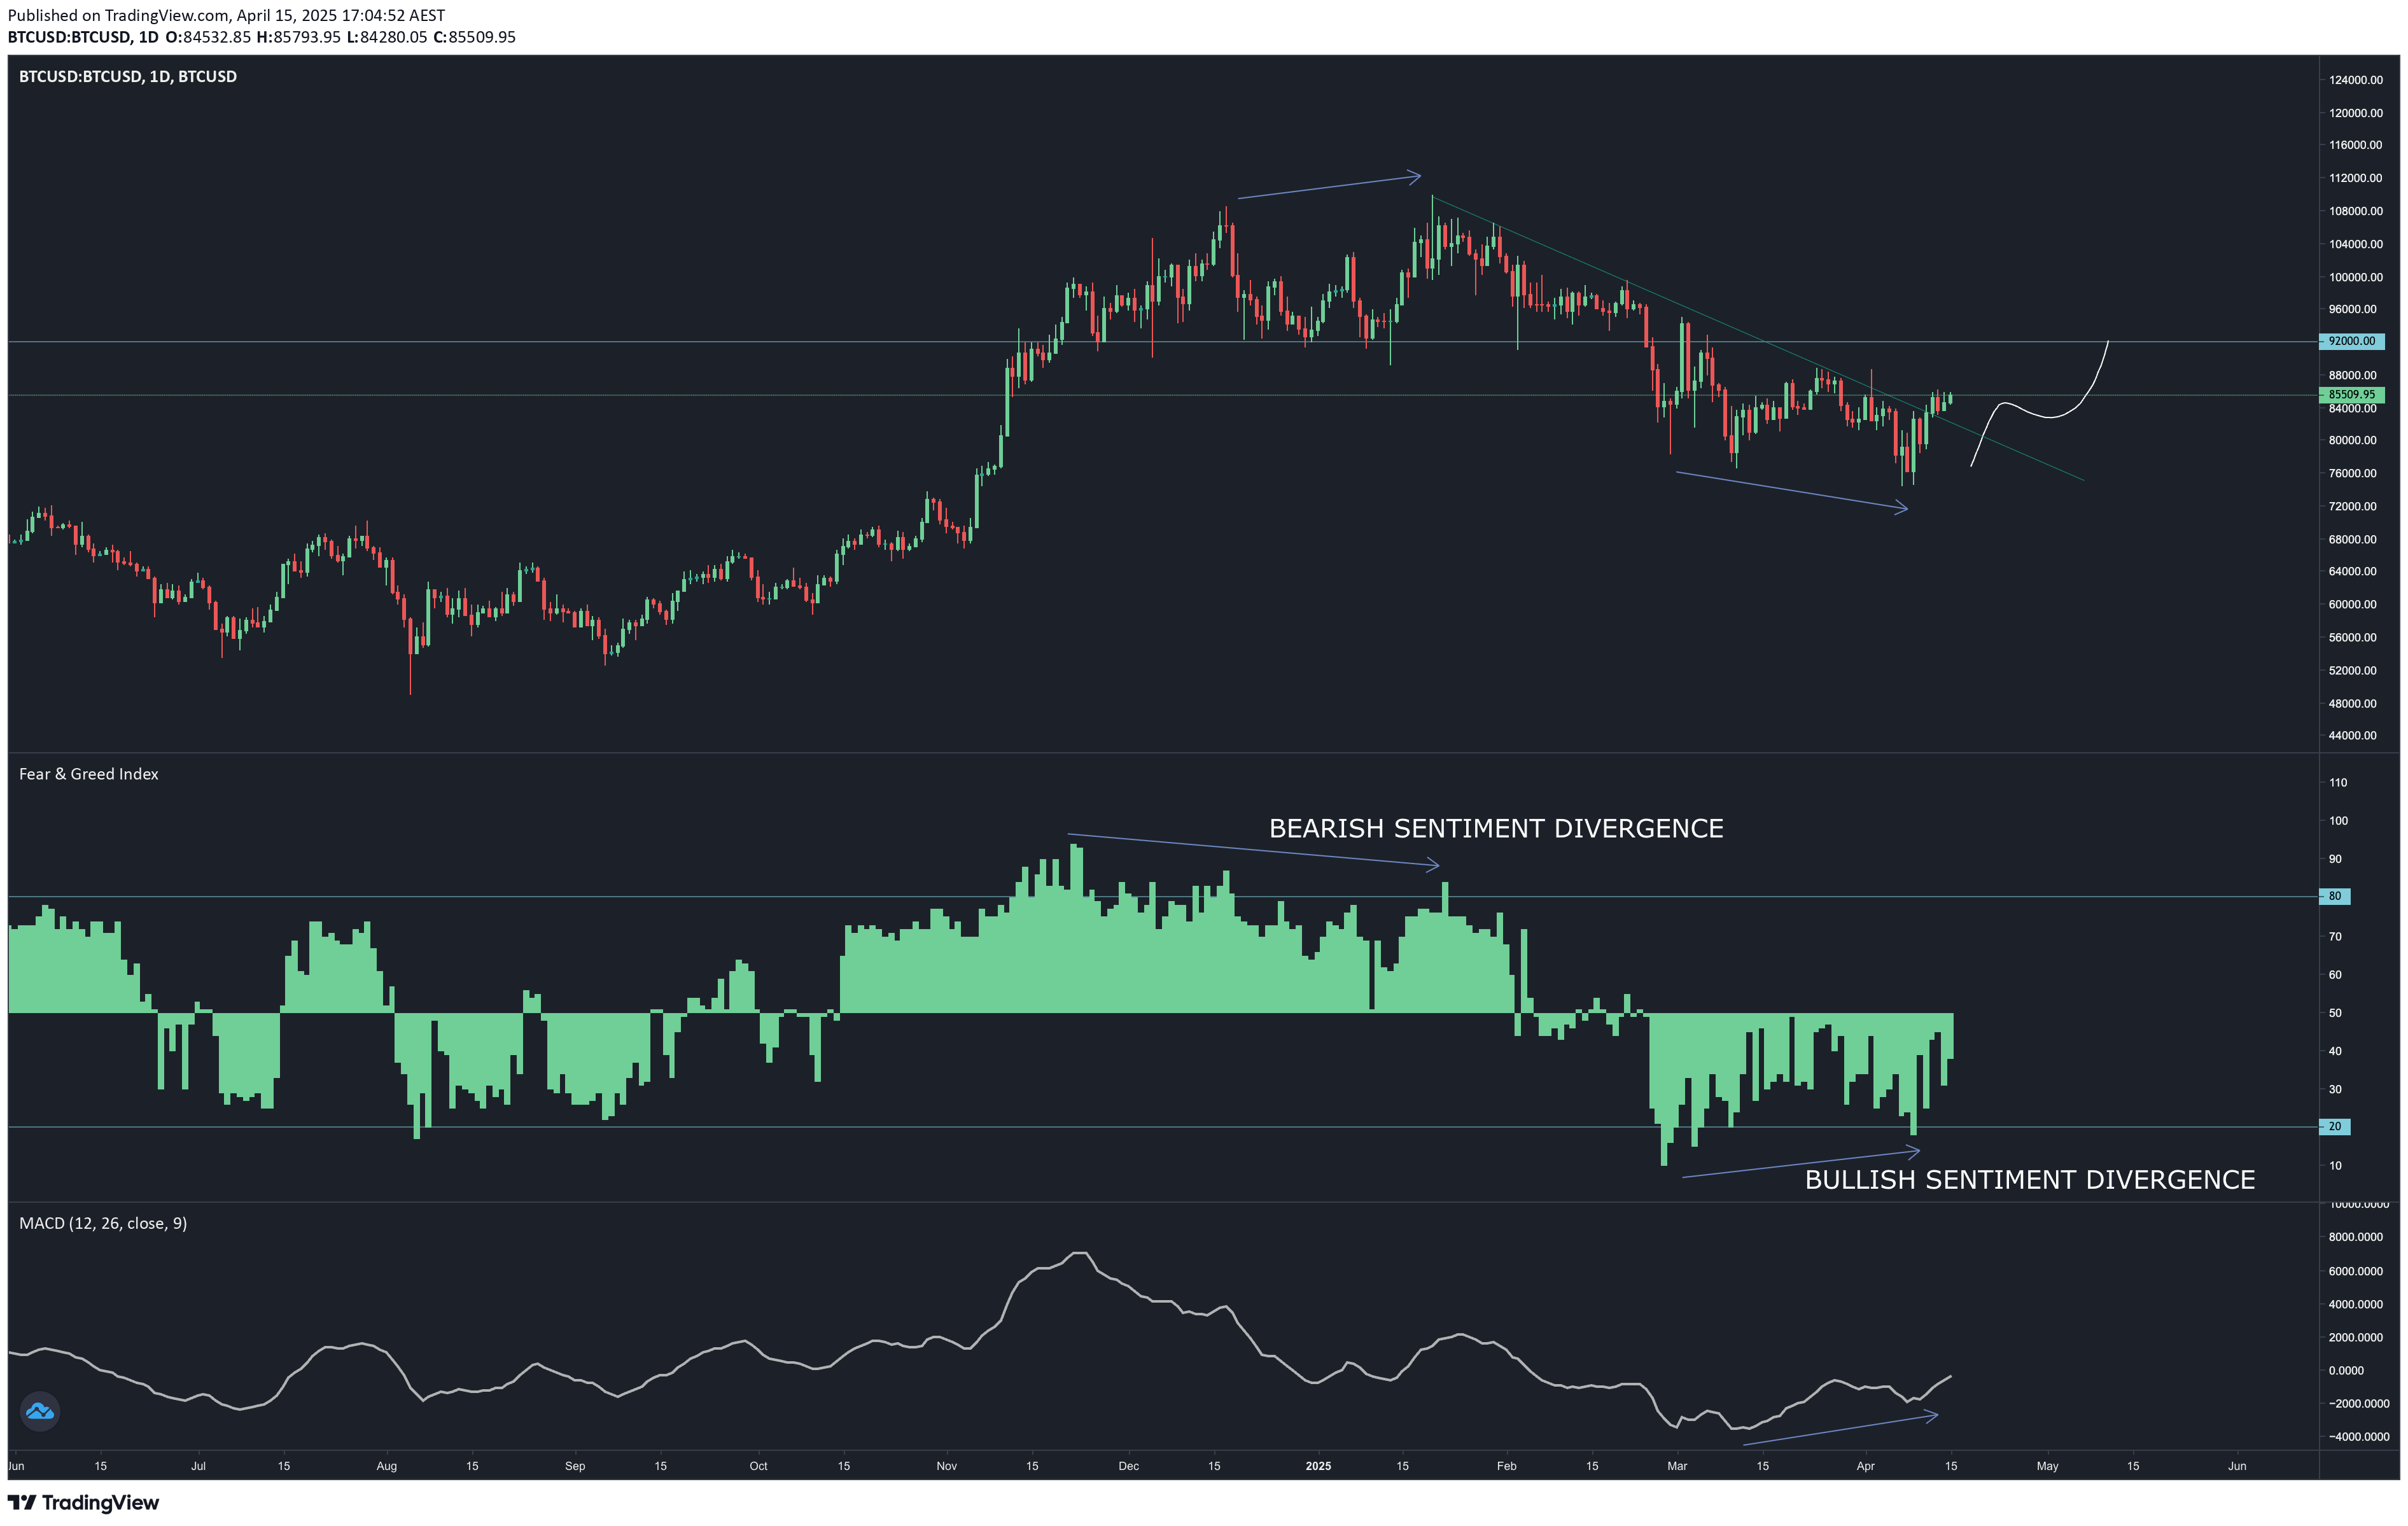
- Sentiment Divergence: The Fear and Greed Index hit a low of 10 during the dip, and formed a higher low at 18, even as price printed a slightly lower low — classic sentiment divergence.
- Momentum Divergence: On the MACD, momentum has been building (higher highs on the MACD signal line), while price made lower lows. This is a key reversal signal I watch closely.
- Wyckoff Accumulation: We’re seeing textbook spring action — a flush below support followed by reclaim — indicating that the market is absorbing final sell pressure before markup.
When these three align — sentiment, momentum, and structure — the TJSS method goes into buy mode.
Portfolio Positioning (Live)
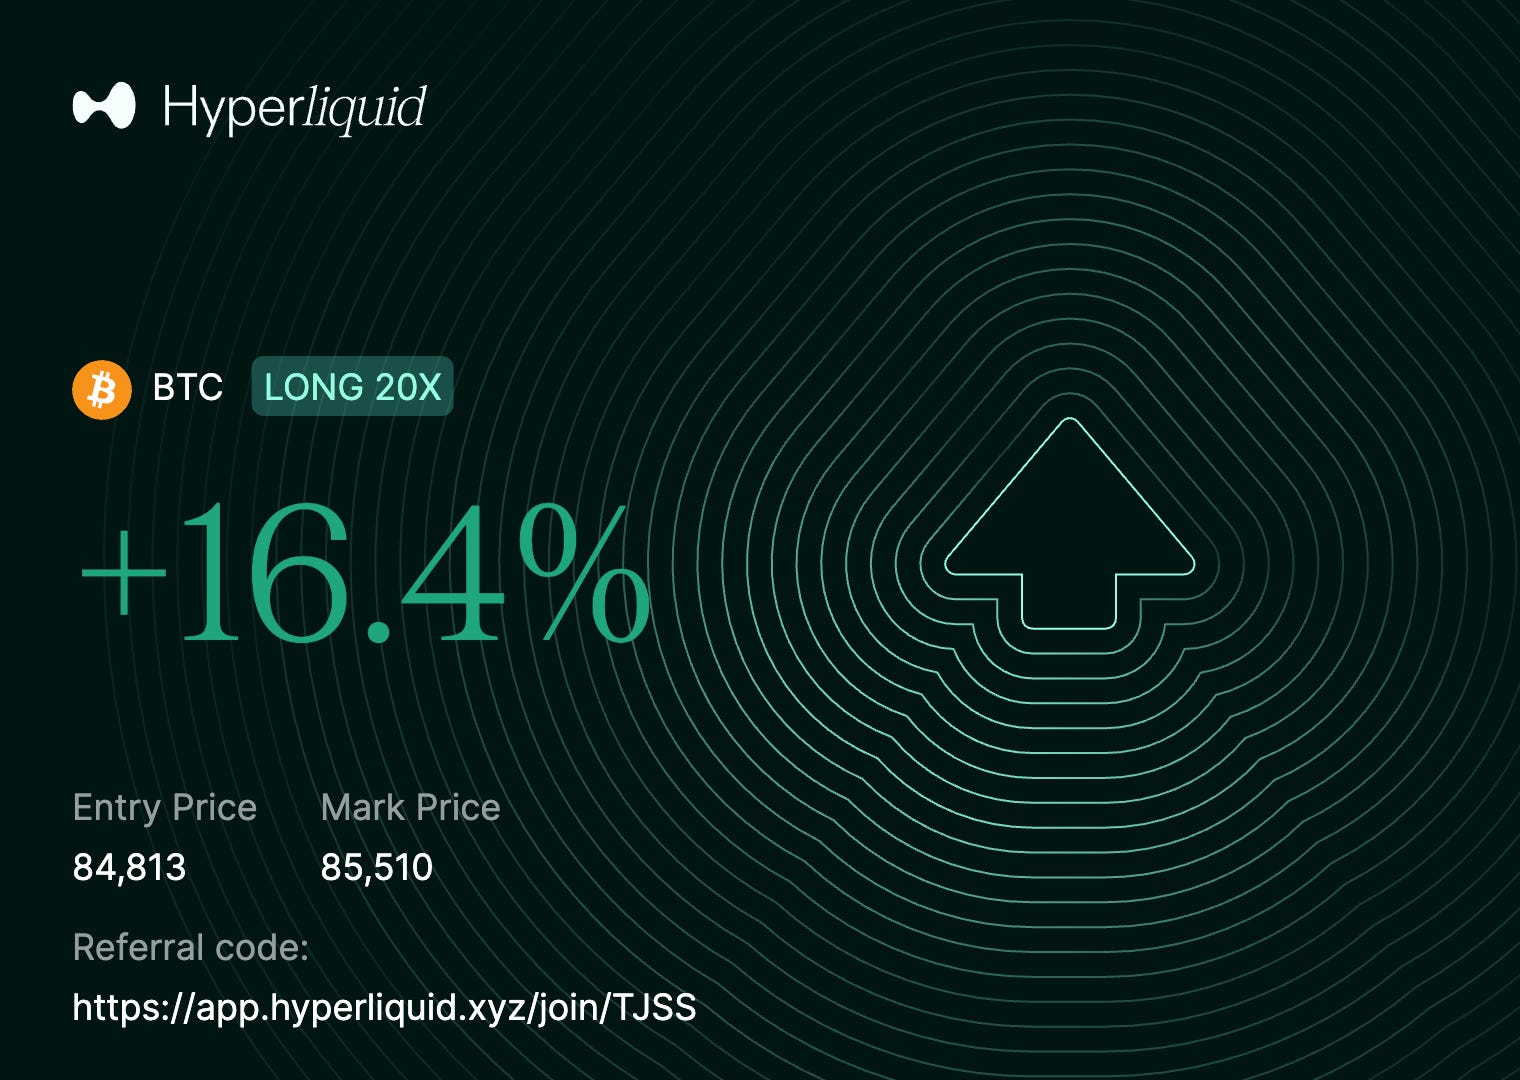
After the STRONG SELL signal triggered above $100,000 (which is where I hedged at $104K), I’ve since begun re-entering the market. Here’s how I’m currently positioned:
Main BTC Position: Accumulation began at $84,000 and below, now holding an average cost just under $80,000.
Leverage Exposure: Added 2x swing long BTC futures to amplify returns into the next Extreme Greed phase.
Target Exit: Planning to reduce leveraged positions and possibly rotate exposure when: BTC hits $137,000, or TJSS flashes a new Extreme Greed signal — whichever happens first.
This current swing carries a -30% to -40% downside risk, but with a +75/90% raw upside, which I believe is highly asymmetric and favorable.
Gameplan Beyond BTC
Remember, the core objective of TJSS isn’t just to make USD — it’s to build more BTC and then compound that BTC through altcoins when they begin outperforming.
• Step 1: Accumulate BTC during fear.
• Step 2: Take profits during greed.
• Step 3: Rotate a portion into high-conviction altcoin swings to increase
BTC-denominated returns.
But until that outperformance rotation begins, BTC remains king.
5. Conclusion: Setting the Stage for What’s Next
This first instalment has laid the foundation — we’ve unpacked the macroeconomic catalysts, broken down the structure of the current correction, and explored how the TJSS Method positions us to trade with conviction, not emotion.
While the headlines have sparked fear, the data tells a different story. Beneath the surface, Bitcoin remains in a structurally strong uptrend, and leading indicators like gold and liquidity trends suggest that capital is preparing to rotate back into risk assets. Corrections like these are not threats — they’re opportunities for those who are prepared.
Coming Soon: Part 2 & Part 3
In Part 2, we’ll dive into:
The Ethereum case study — and why ETH could be on the verge of a parabolic rotation.
A breakdown of the “GME 2.0” short squeeze thesis — what’s brewing beneath the surface of the ETH/BTC chart and what it tells us about risk sentiment and market structure.
In Part 3, I’ll reveal a high-conviction altcoin that I believe could lead the next leg of the cycle — and potentially become the strongest performer of 2026. You’ll get the full breakdown: narrative, tokenomics, on-chain positioning, and my long-term game plan.
📩 Stay Connected — Don’t Miss What’s Next
If you’ve found value in this report, here’s how to keep your edge:
→ Join the Email List — Get notified the moment Parts 2 and 3 drop, and receive exclusive macro and micro analysis directly in your inbox.
→ Join the Free Community — Access live updates, weekly video analysis, market discussions, and unlock The Blueprint - a Free Crypto Trading Course, where I teach the full TJSS Method.
This community is built to give you real-time insights, proven systems, and a space to trade with confidence.
Thanks for reading — and I’ll see you in the next report and in the community.
— Tom Johnston
Instagram: http://instagram.com/officialtomj/